
The Drivers of Farmland Returns - A Review of all AcreTrader LLC Farmland Realized Exits as of Q3 2026
Key Points:
- Realized Investment Performance of all 76 AcreTrader LLC managed farmland exits 2019 - Q3 2026
- 74 of AcreTrader LLC's 76 exits Net IRRs outperformed the NCREIF Total Farmland Index Gross IRR by an average of 481 basis points
01 · AcreTrader Overview
THE PLATFORM
Background on the Company, the structure of each investment, and a summary of the 76 realized dispositions.
ACRETRADER. Founded in Fayetteville, Arkansas in 2018, the platform acquires investment-grade row crop farms in core United States farming regions. Potential returns are generated through farmland appreciation, the spread between purchase and sale price, and contractual lease income from operating farmers. AcreTrader operated independently from its first closed offering in 2019 until 2025, when it was acquired by Proterra Investment Partners, a global asset manager focused on food and agriculture.
INVESTMENT STRUCTURE. Each farm is held by an individual partnership, with its own investors and separate financials. Investors purchase interests in the partnership, which acquires and holds the farm for a target hold period. At exit, the farm is sold and proceeds are distributed to investors net of all fees and expenses. Each partnership is managed by AcreTrader LLC for the life of the investment under a management agreement.
THE DISPOSITIONS
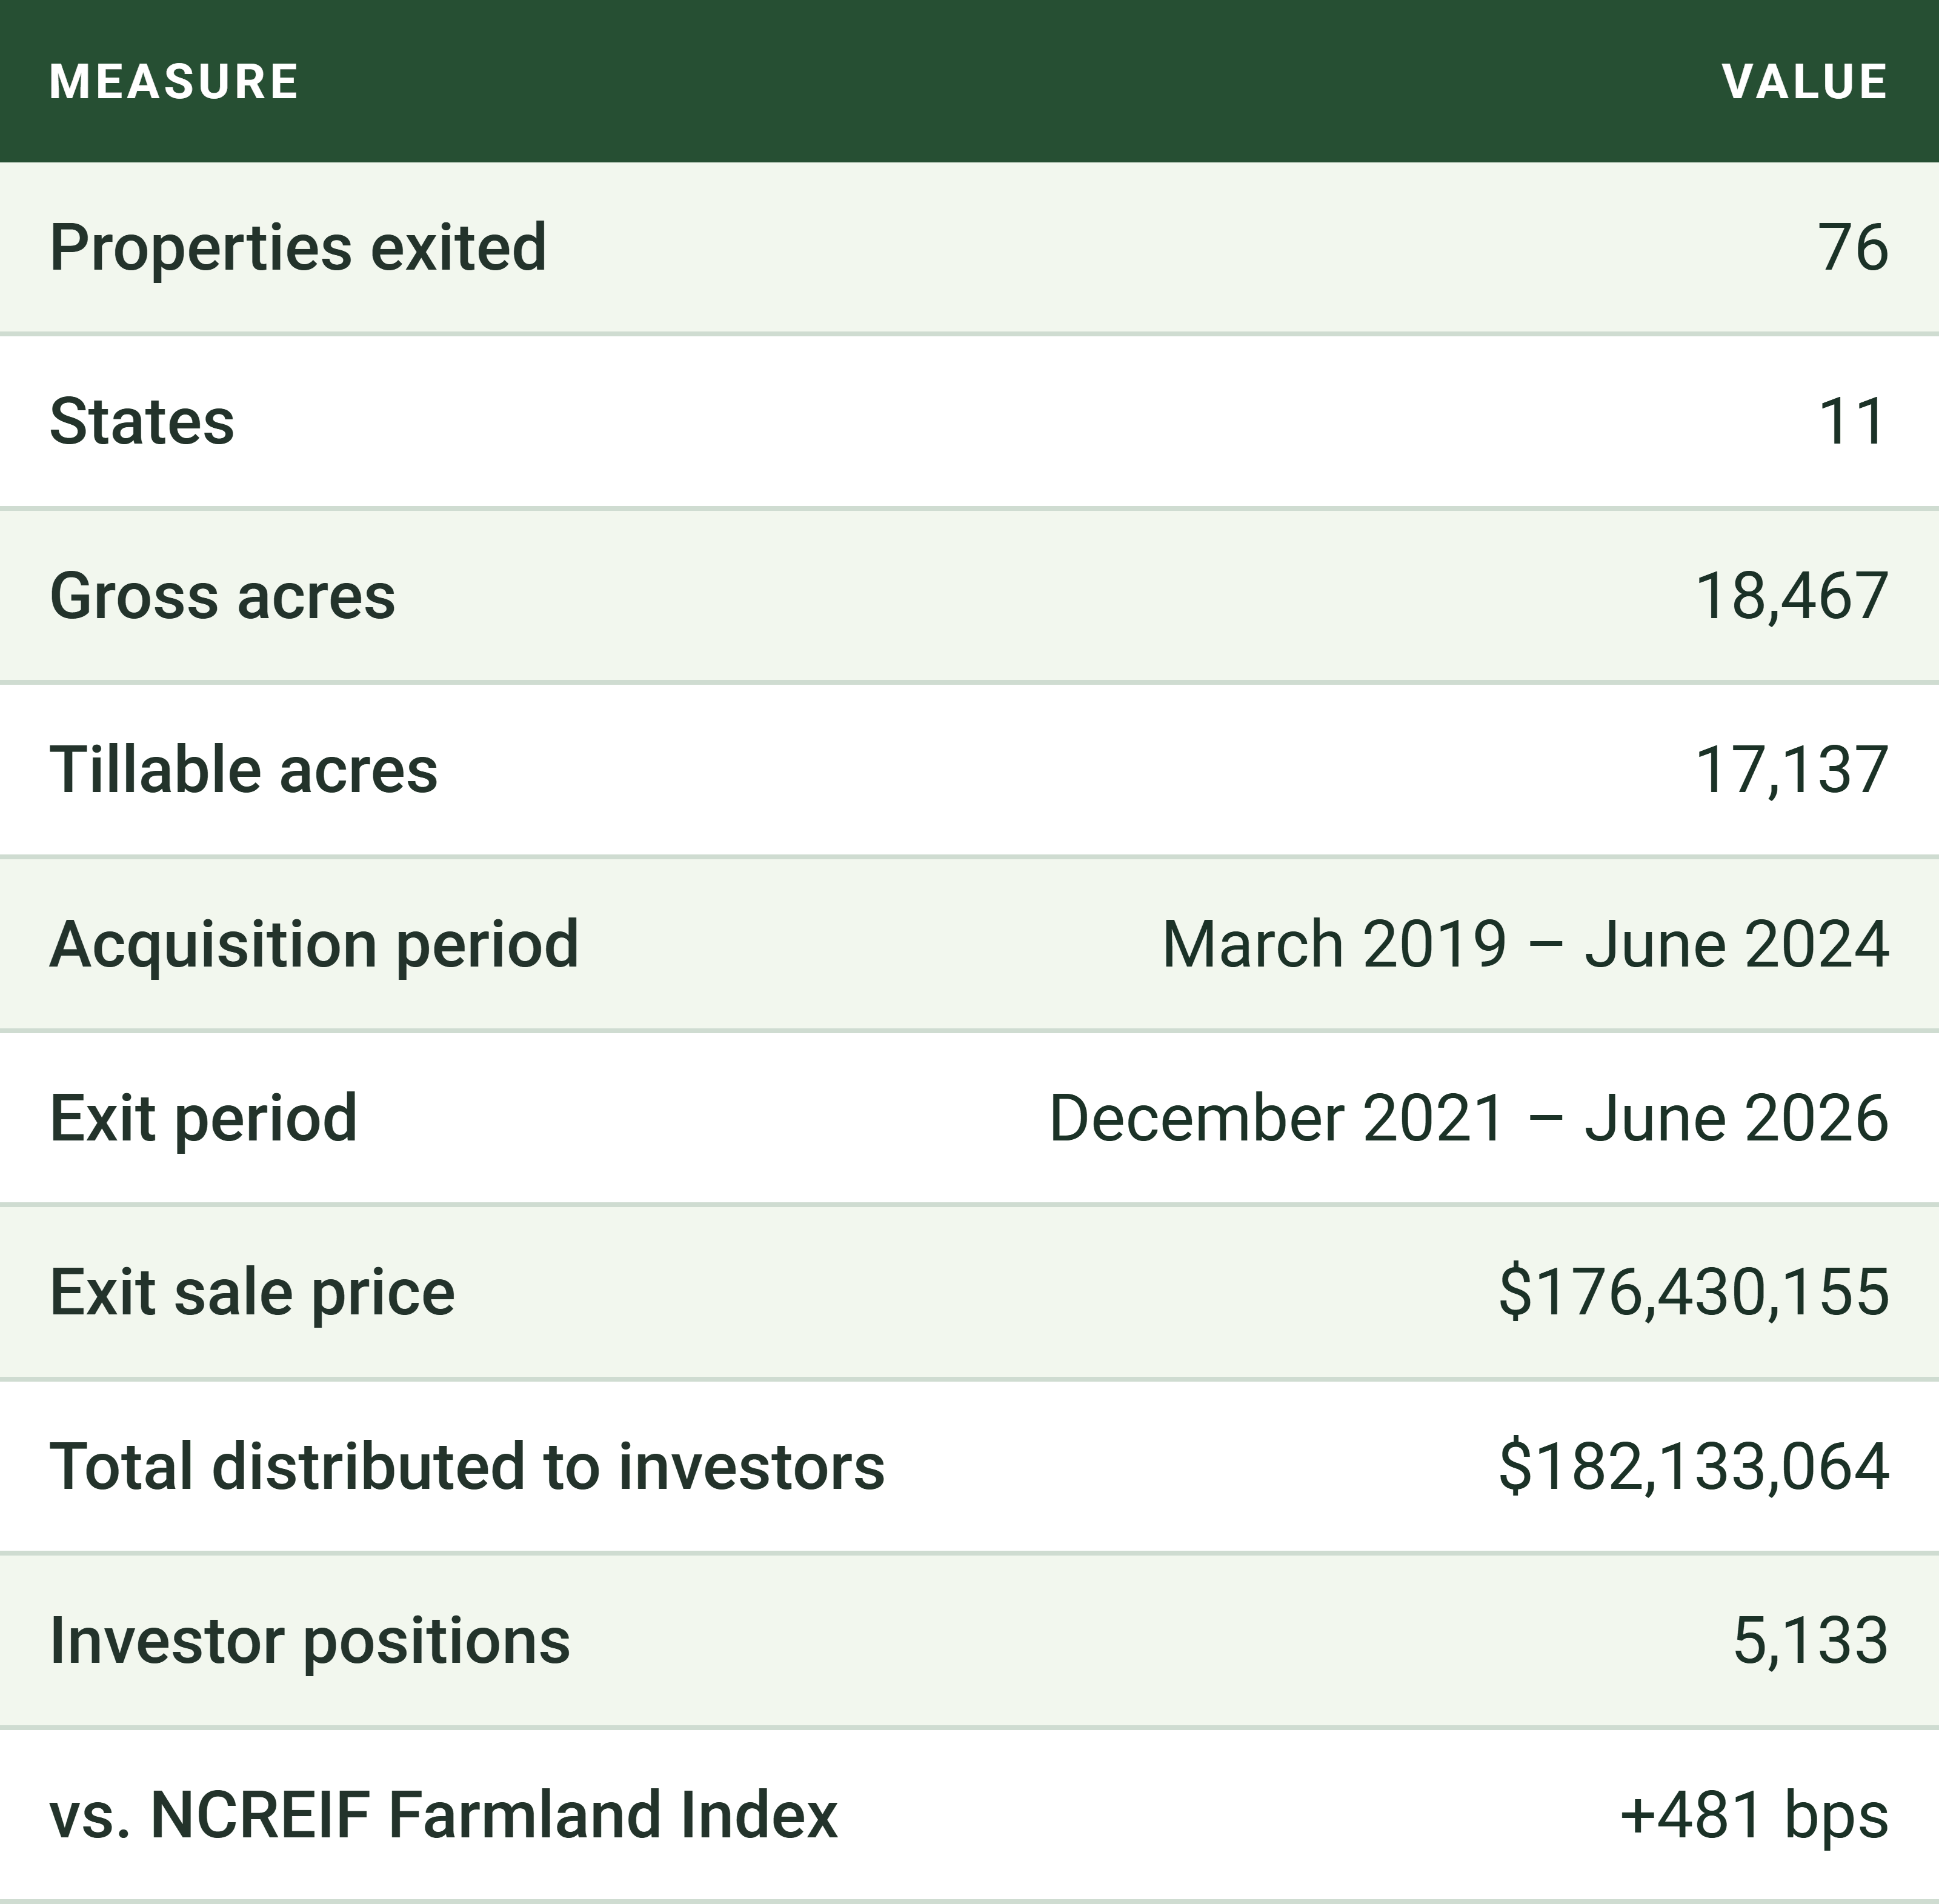
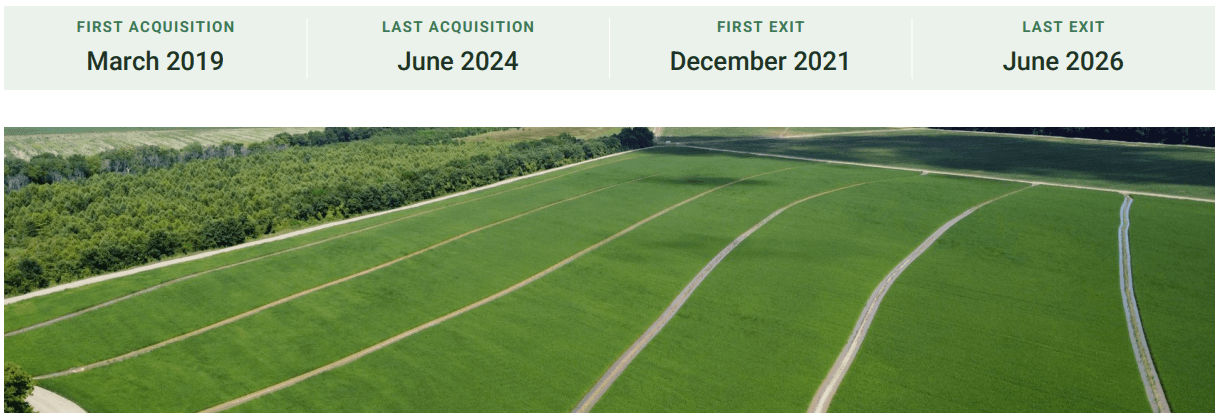
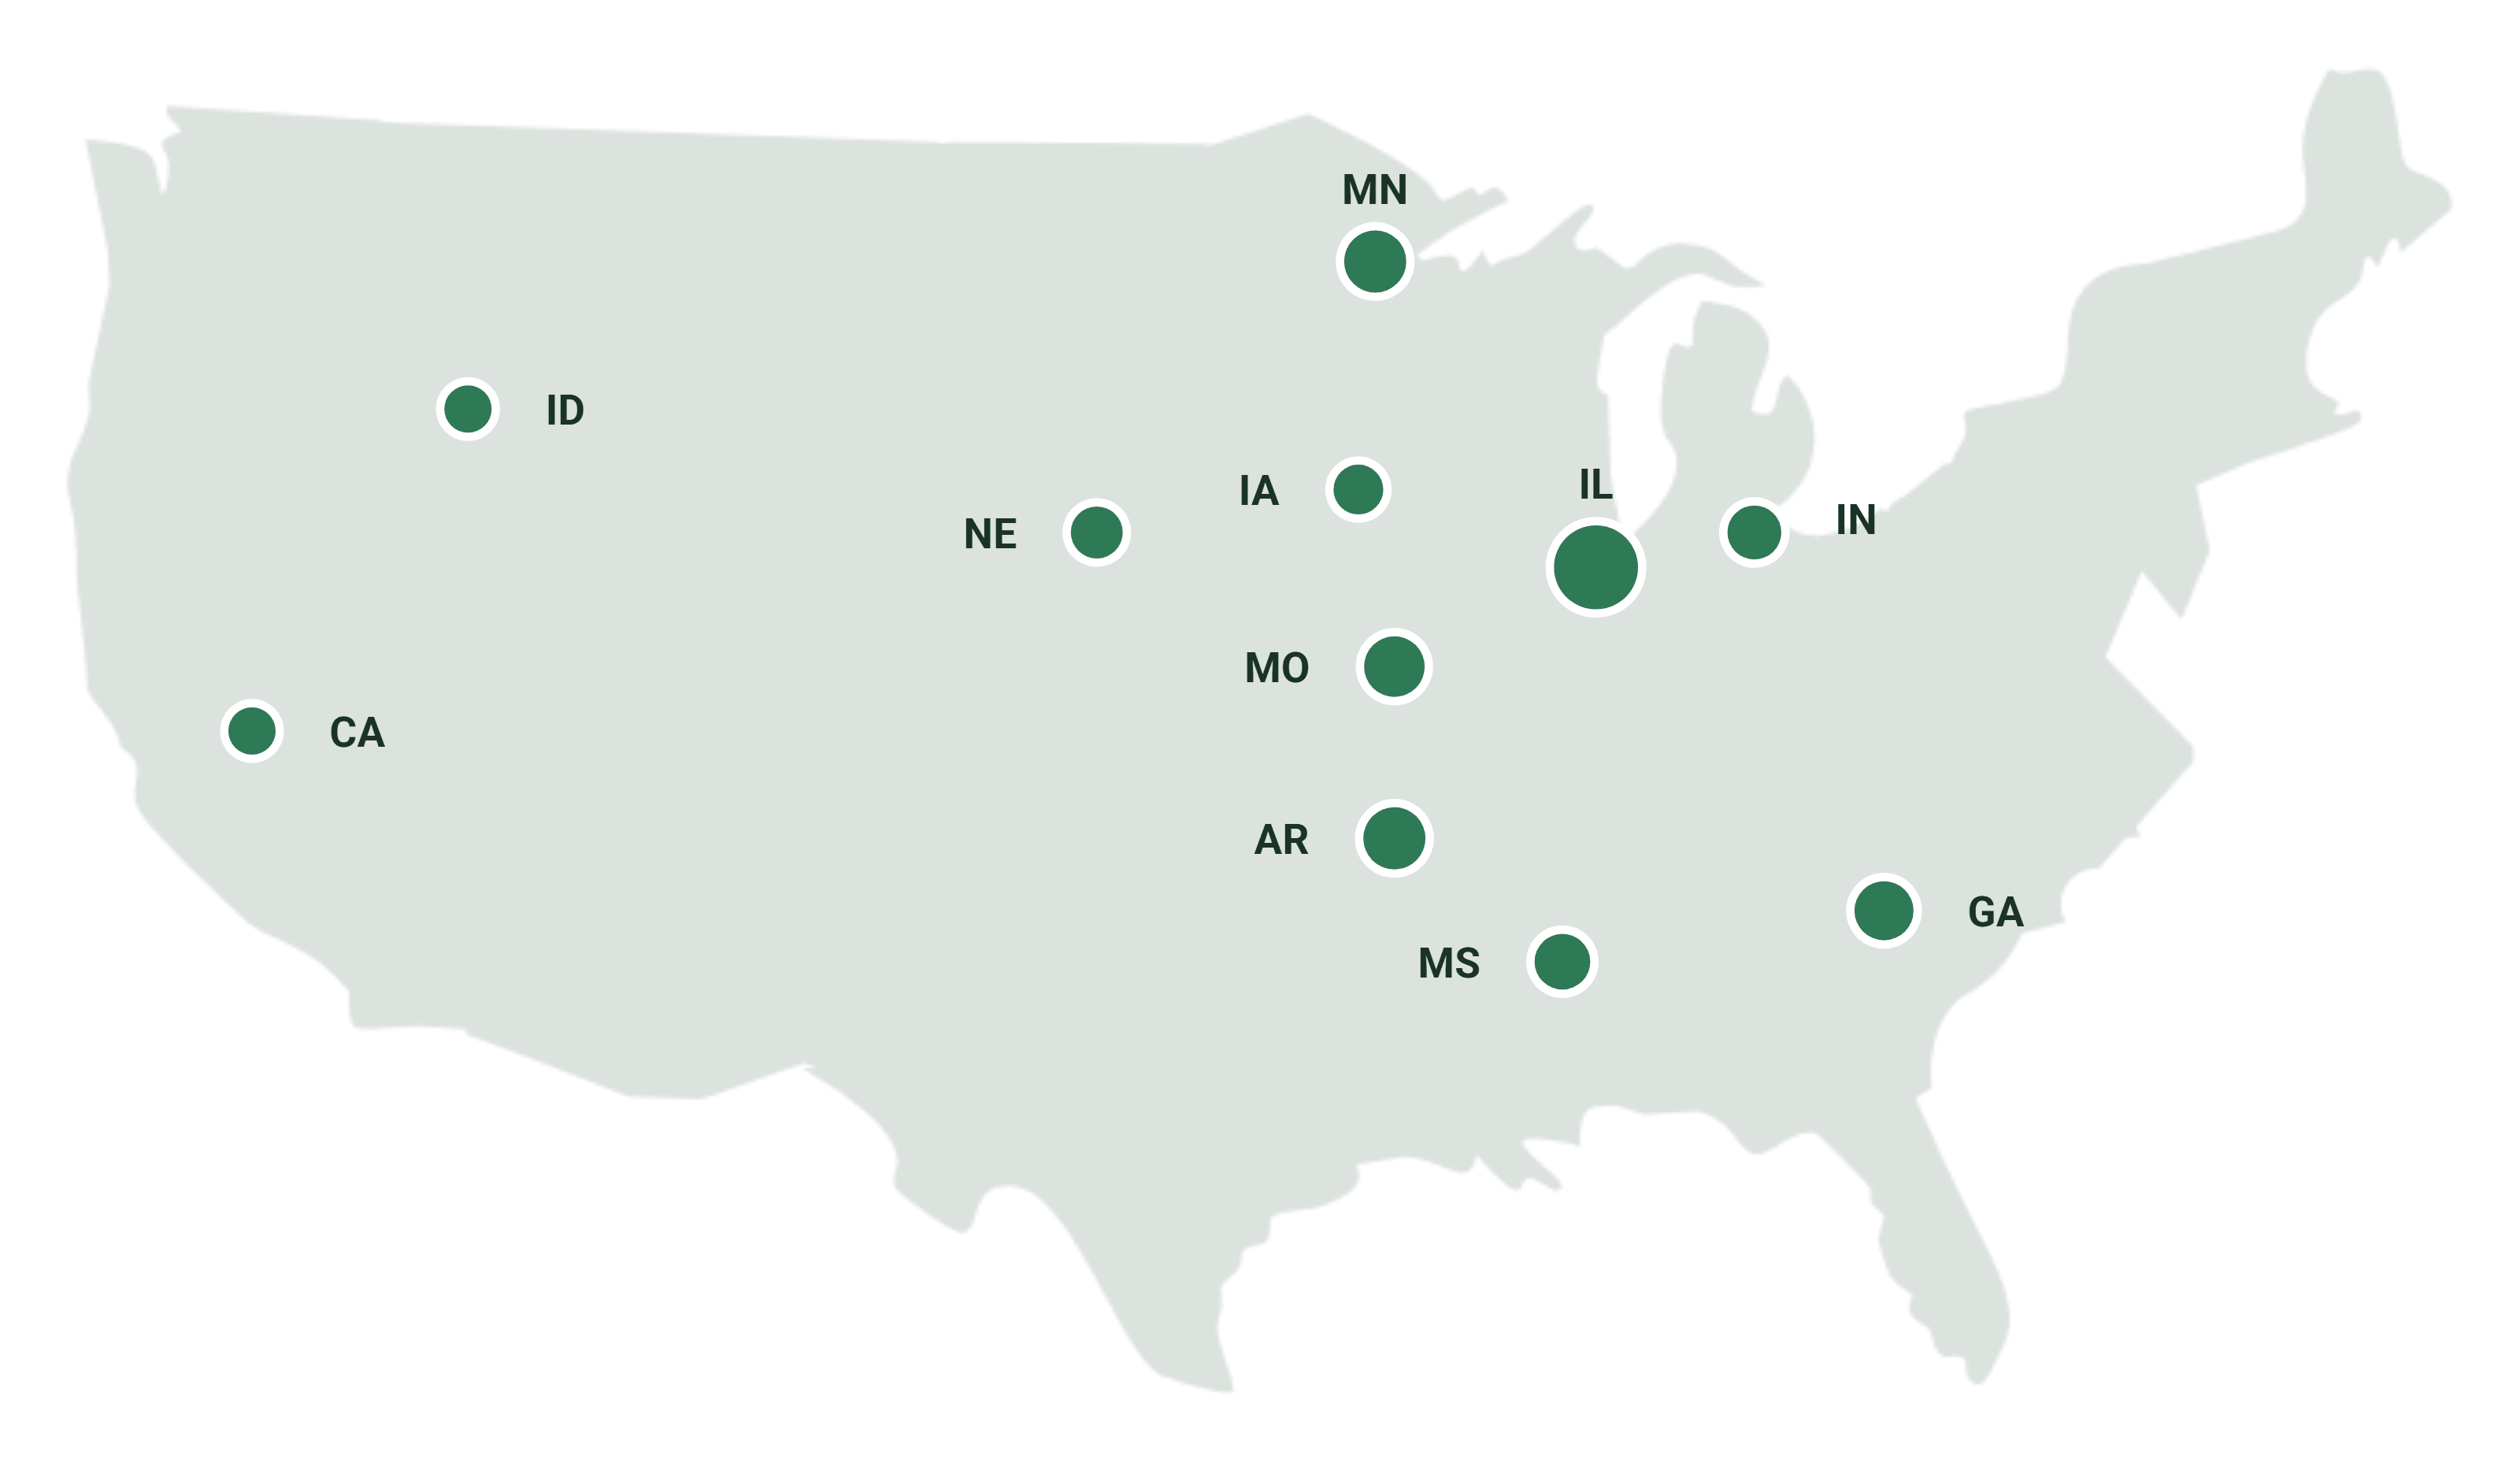
This report covers the 76 internally-managed farm dispositions, spanning acquisitions from 2019 through 2024 and exits from 2021 through 2026. The farms cover 11 states and 18,467 gross acres, of which 17,137 are tillable.
Across an average hold period of 4.3 years, these exits returned $182,133,064 to investors on $137,748,420 of equity raised, a return on capital of 1.32x.
Each partnership was measured against the NCREIF Farmland Index, the standard institutional benchmark for United States farmland. On average, the 76 exits outperformed the benchmark by 481 basis points, with 74 of the 76 exits outperforming. Section 05 sets out the comparison in full.
TRANSACTION SUMMARY
02 · The Farms
THE PORTFOLIO
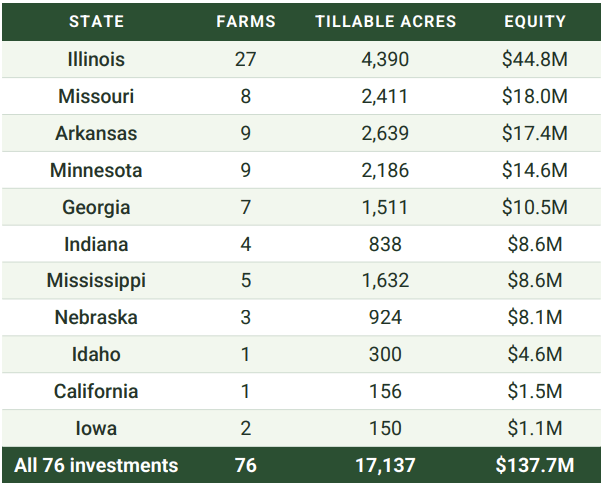
76 farms across 11 states, acquired between 2019 and 2024.
ENTRY BASIS BY ACQUISITION VINTAGE
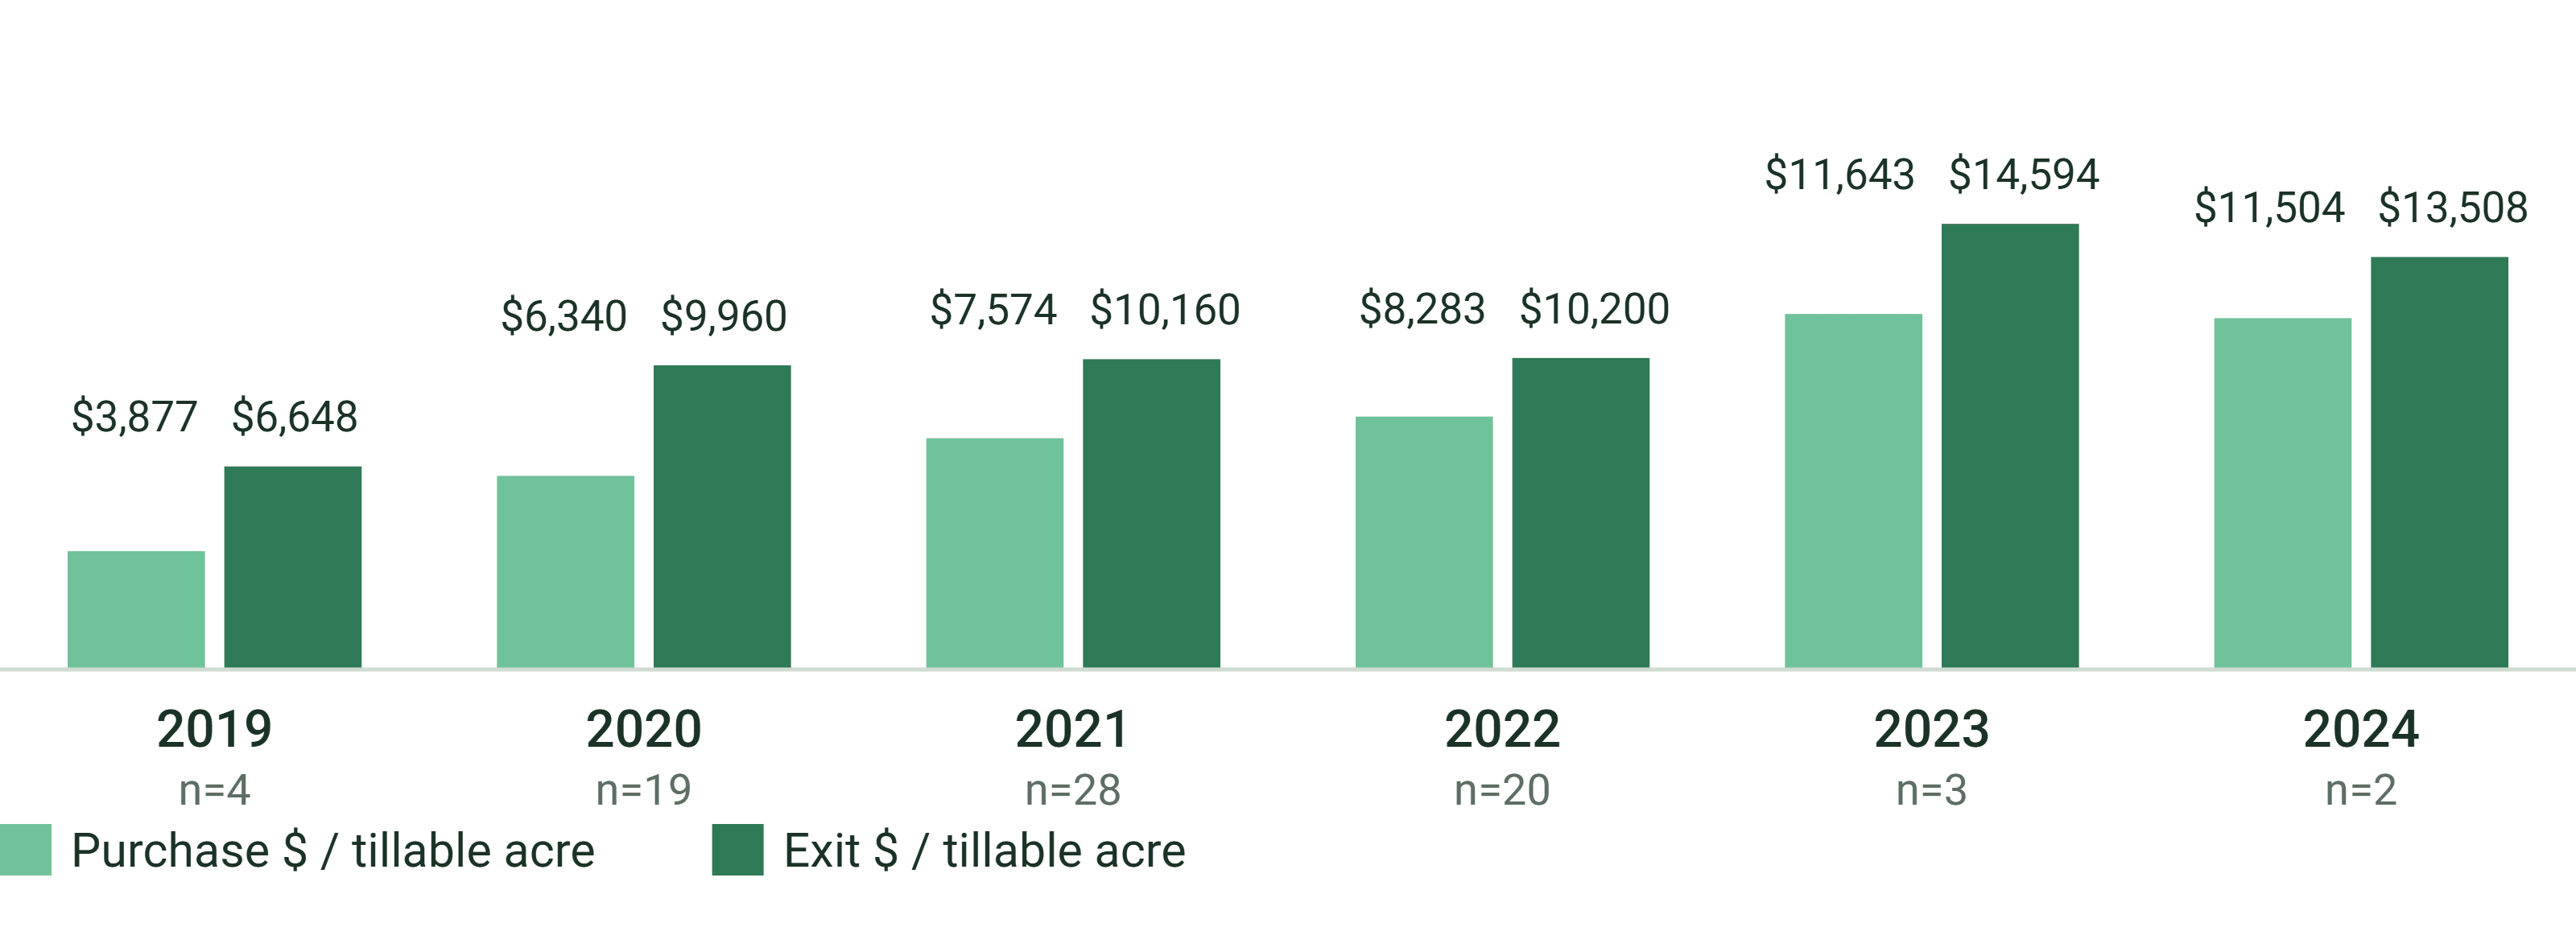
WHEN IT WAS BOUGHT. Acquisition vintages span 2019 to 2024. The 2019 vintage sold for 71.5% more per tillable acre than purchased for, and returned 13.2%; the 2024 vintage for 17.4% more and returned 5.2%. Across the portfolio, the exit price was 33.3% above purchase on a per tillable acre basis.
One farm straddles the Illinois and Indiana line and is counted once, in Illinois.
03 · Results at Exit
PERFORMANCE
Every figure in this section is net of all fees and expenses and is supported by the financials of each partnership.
- EQUITY RAISED: $137,748,420
- TOTAL DISTRIBUTED: $182,133,064
- TOTAL RETURN TO INVESTORS: $44,384,644
- RETURN ON CAPITAL (MOIC): 1.32x
- AVERAGE HOLD PERIOD: 4.3 yrs
DISTRIBUTION OF REALIZED RETURNS
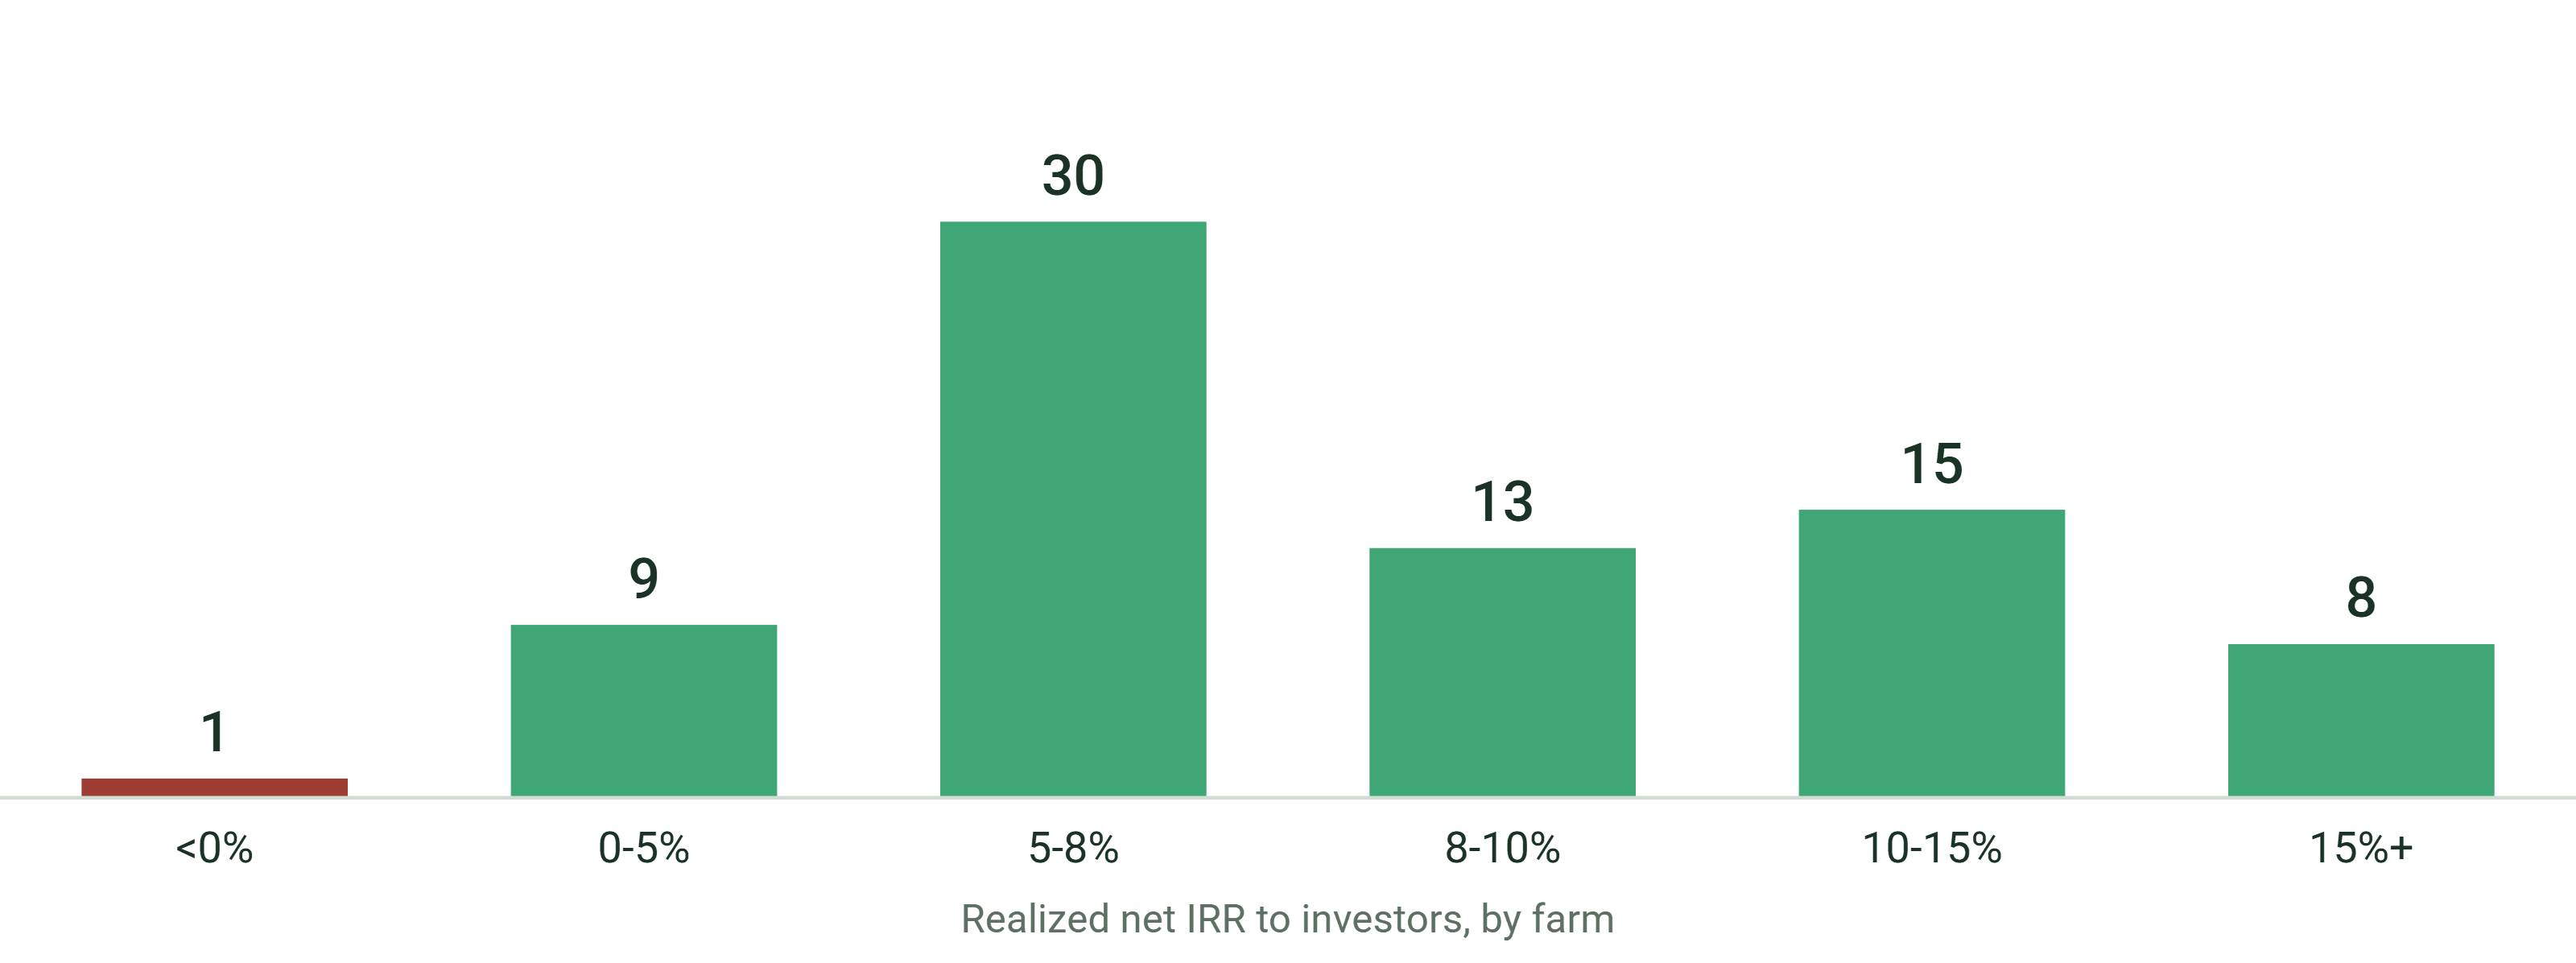
THE SPREAD
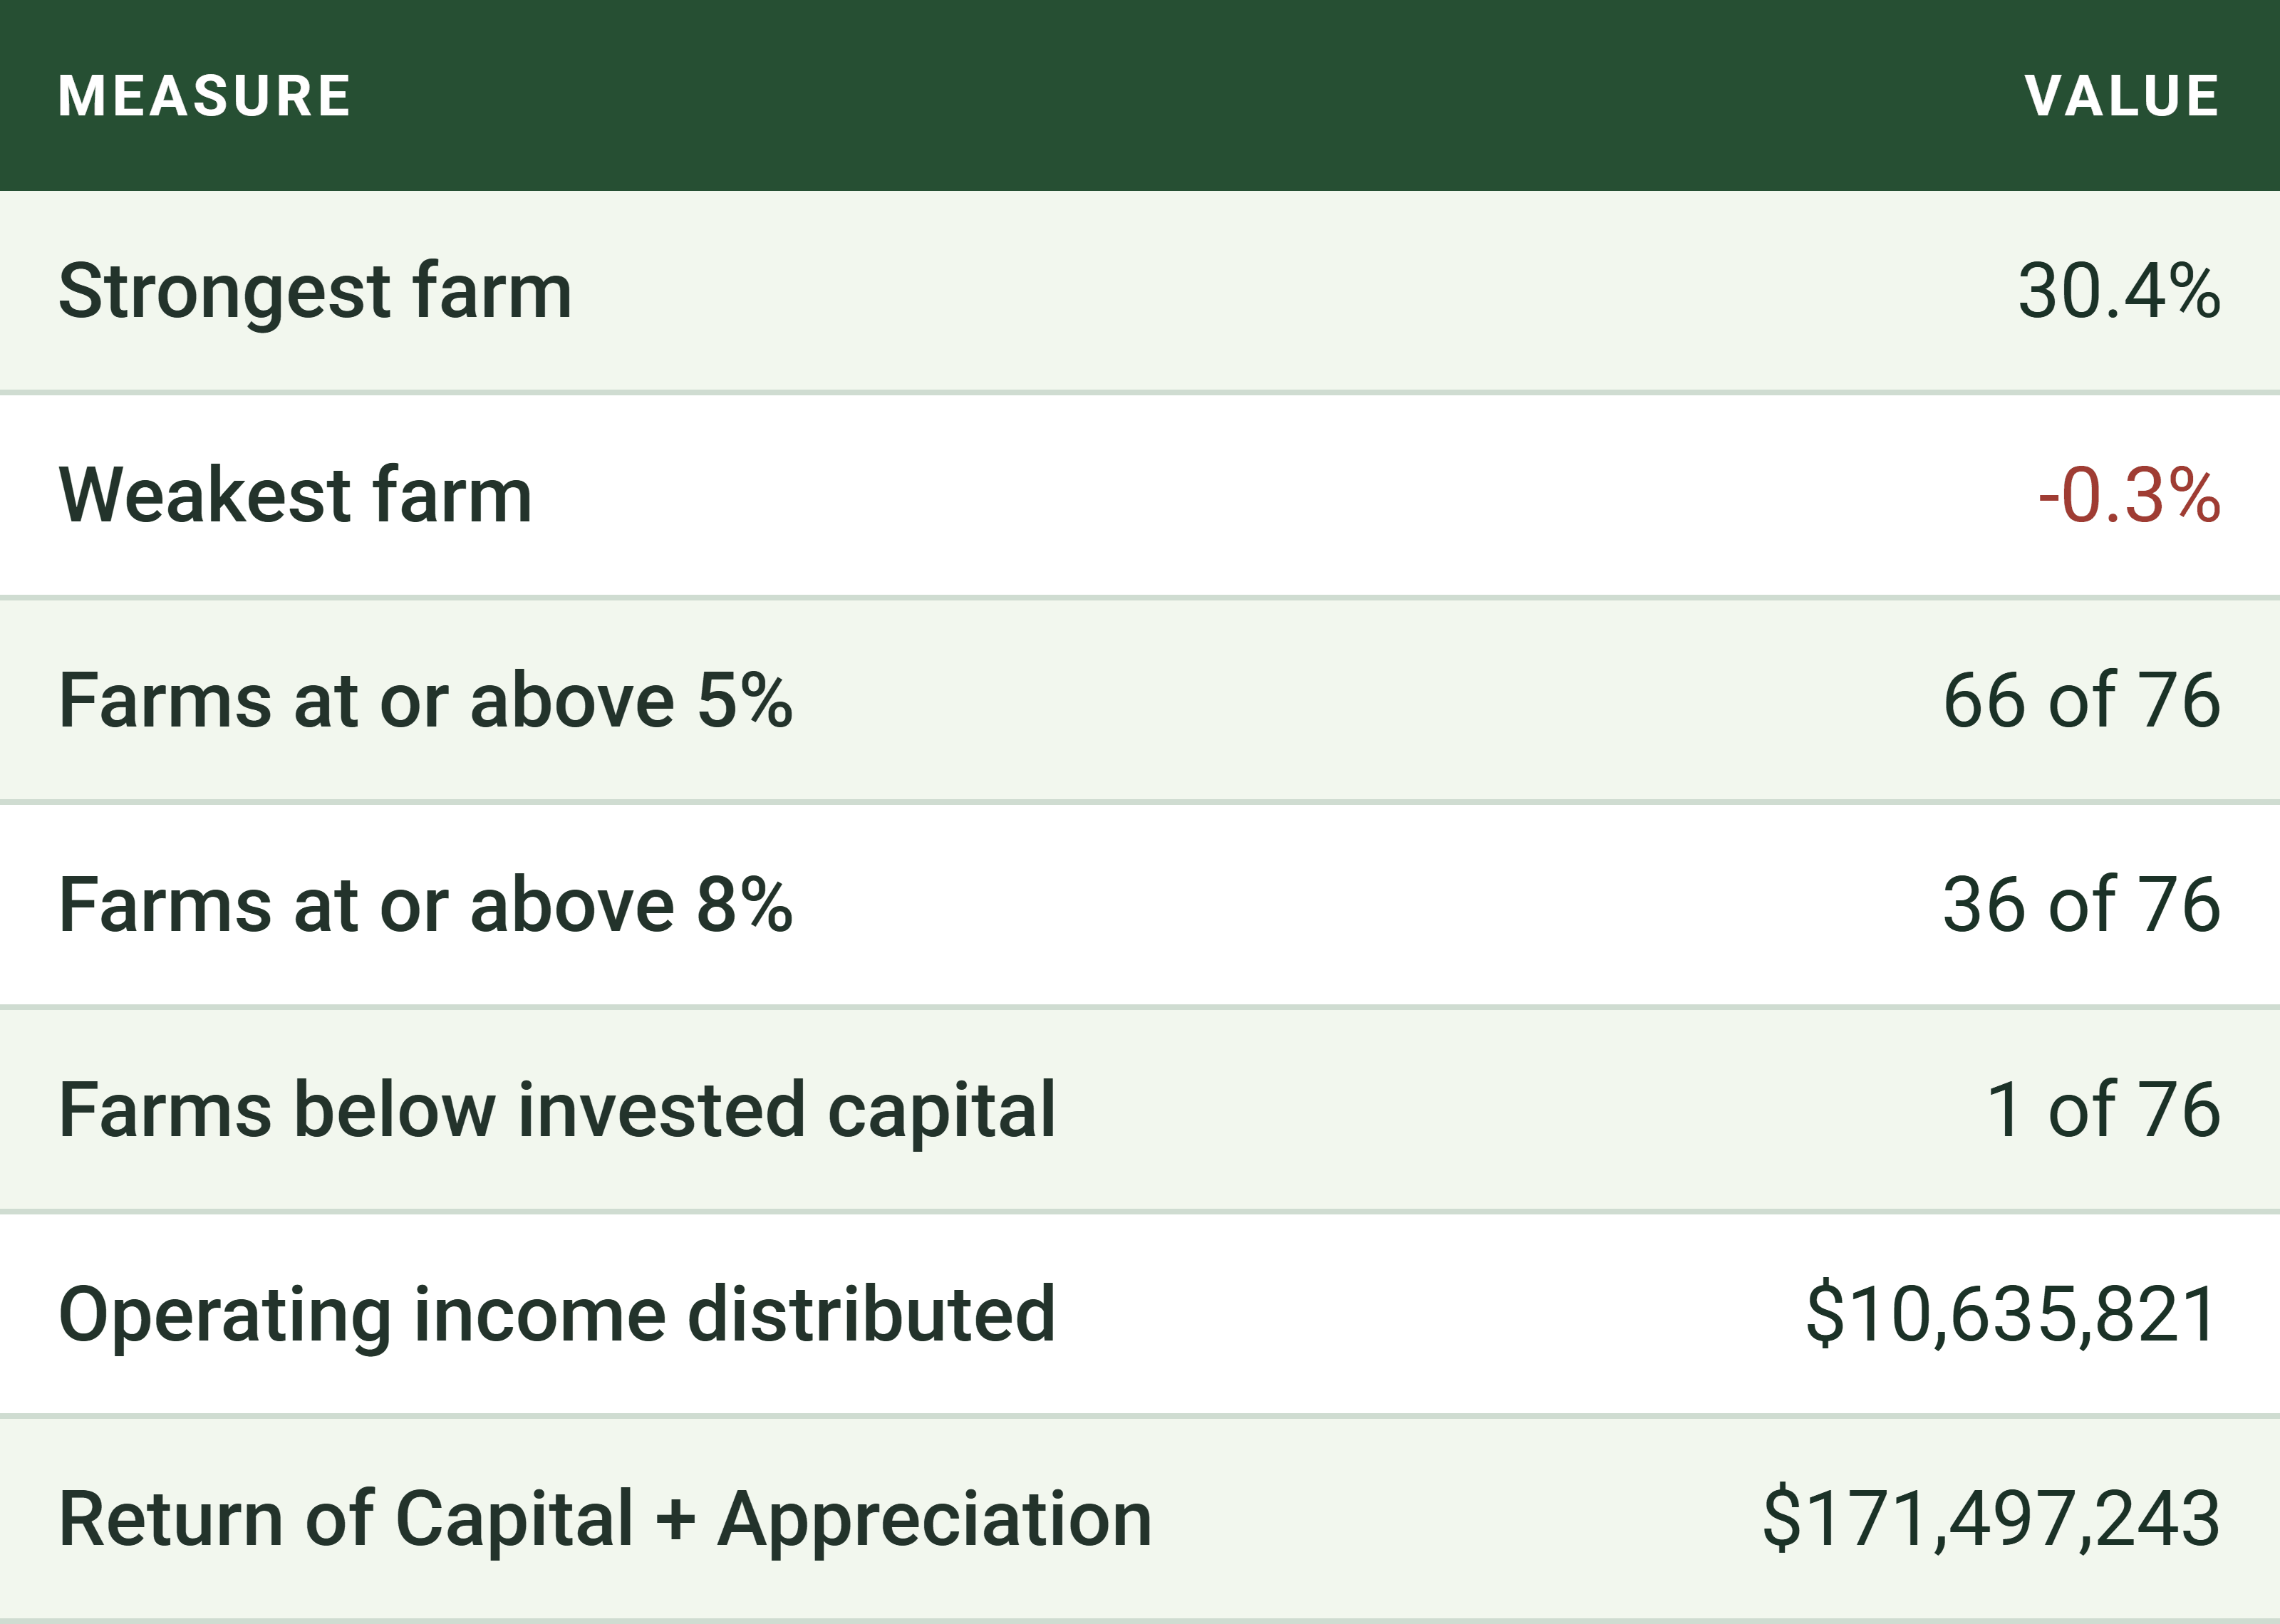

ON THE HOLD PERIOD. Hold period is measured from each farm's property purchase settlement to its final distribution of capital, a simple average of 4.3 years across the 76 exits and 4.2 years weighted by equity raised, ranging from 1.3 to 6.8 years. Portfolio return figures are the simple average of the 76 entity-level results unless labelled otherwise. Definitions are set out in full in the final section.
04 · The Investment Walk
SOURCES AND USES
Every dollar raised, earned and spent across the 76 partnerships.
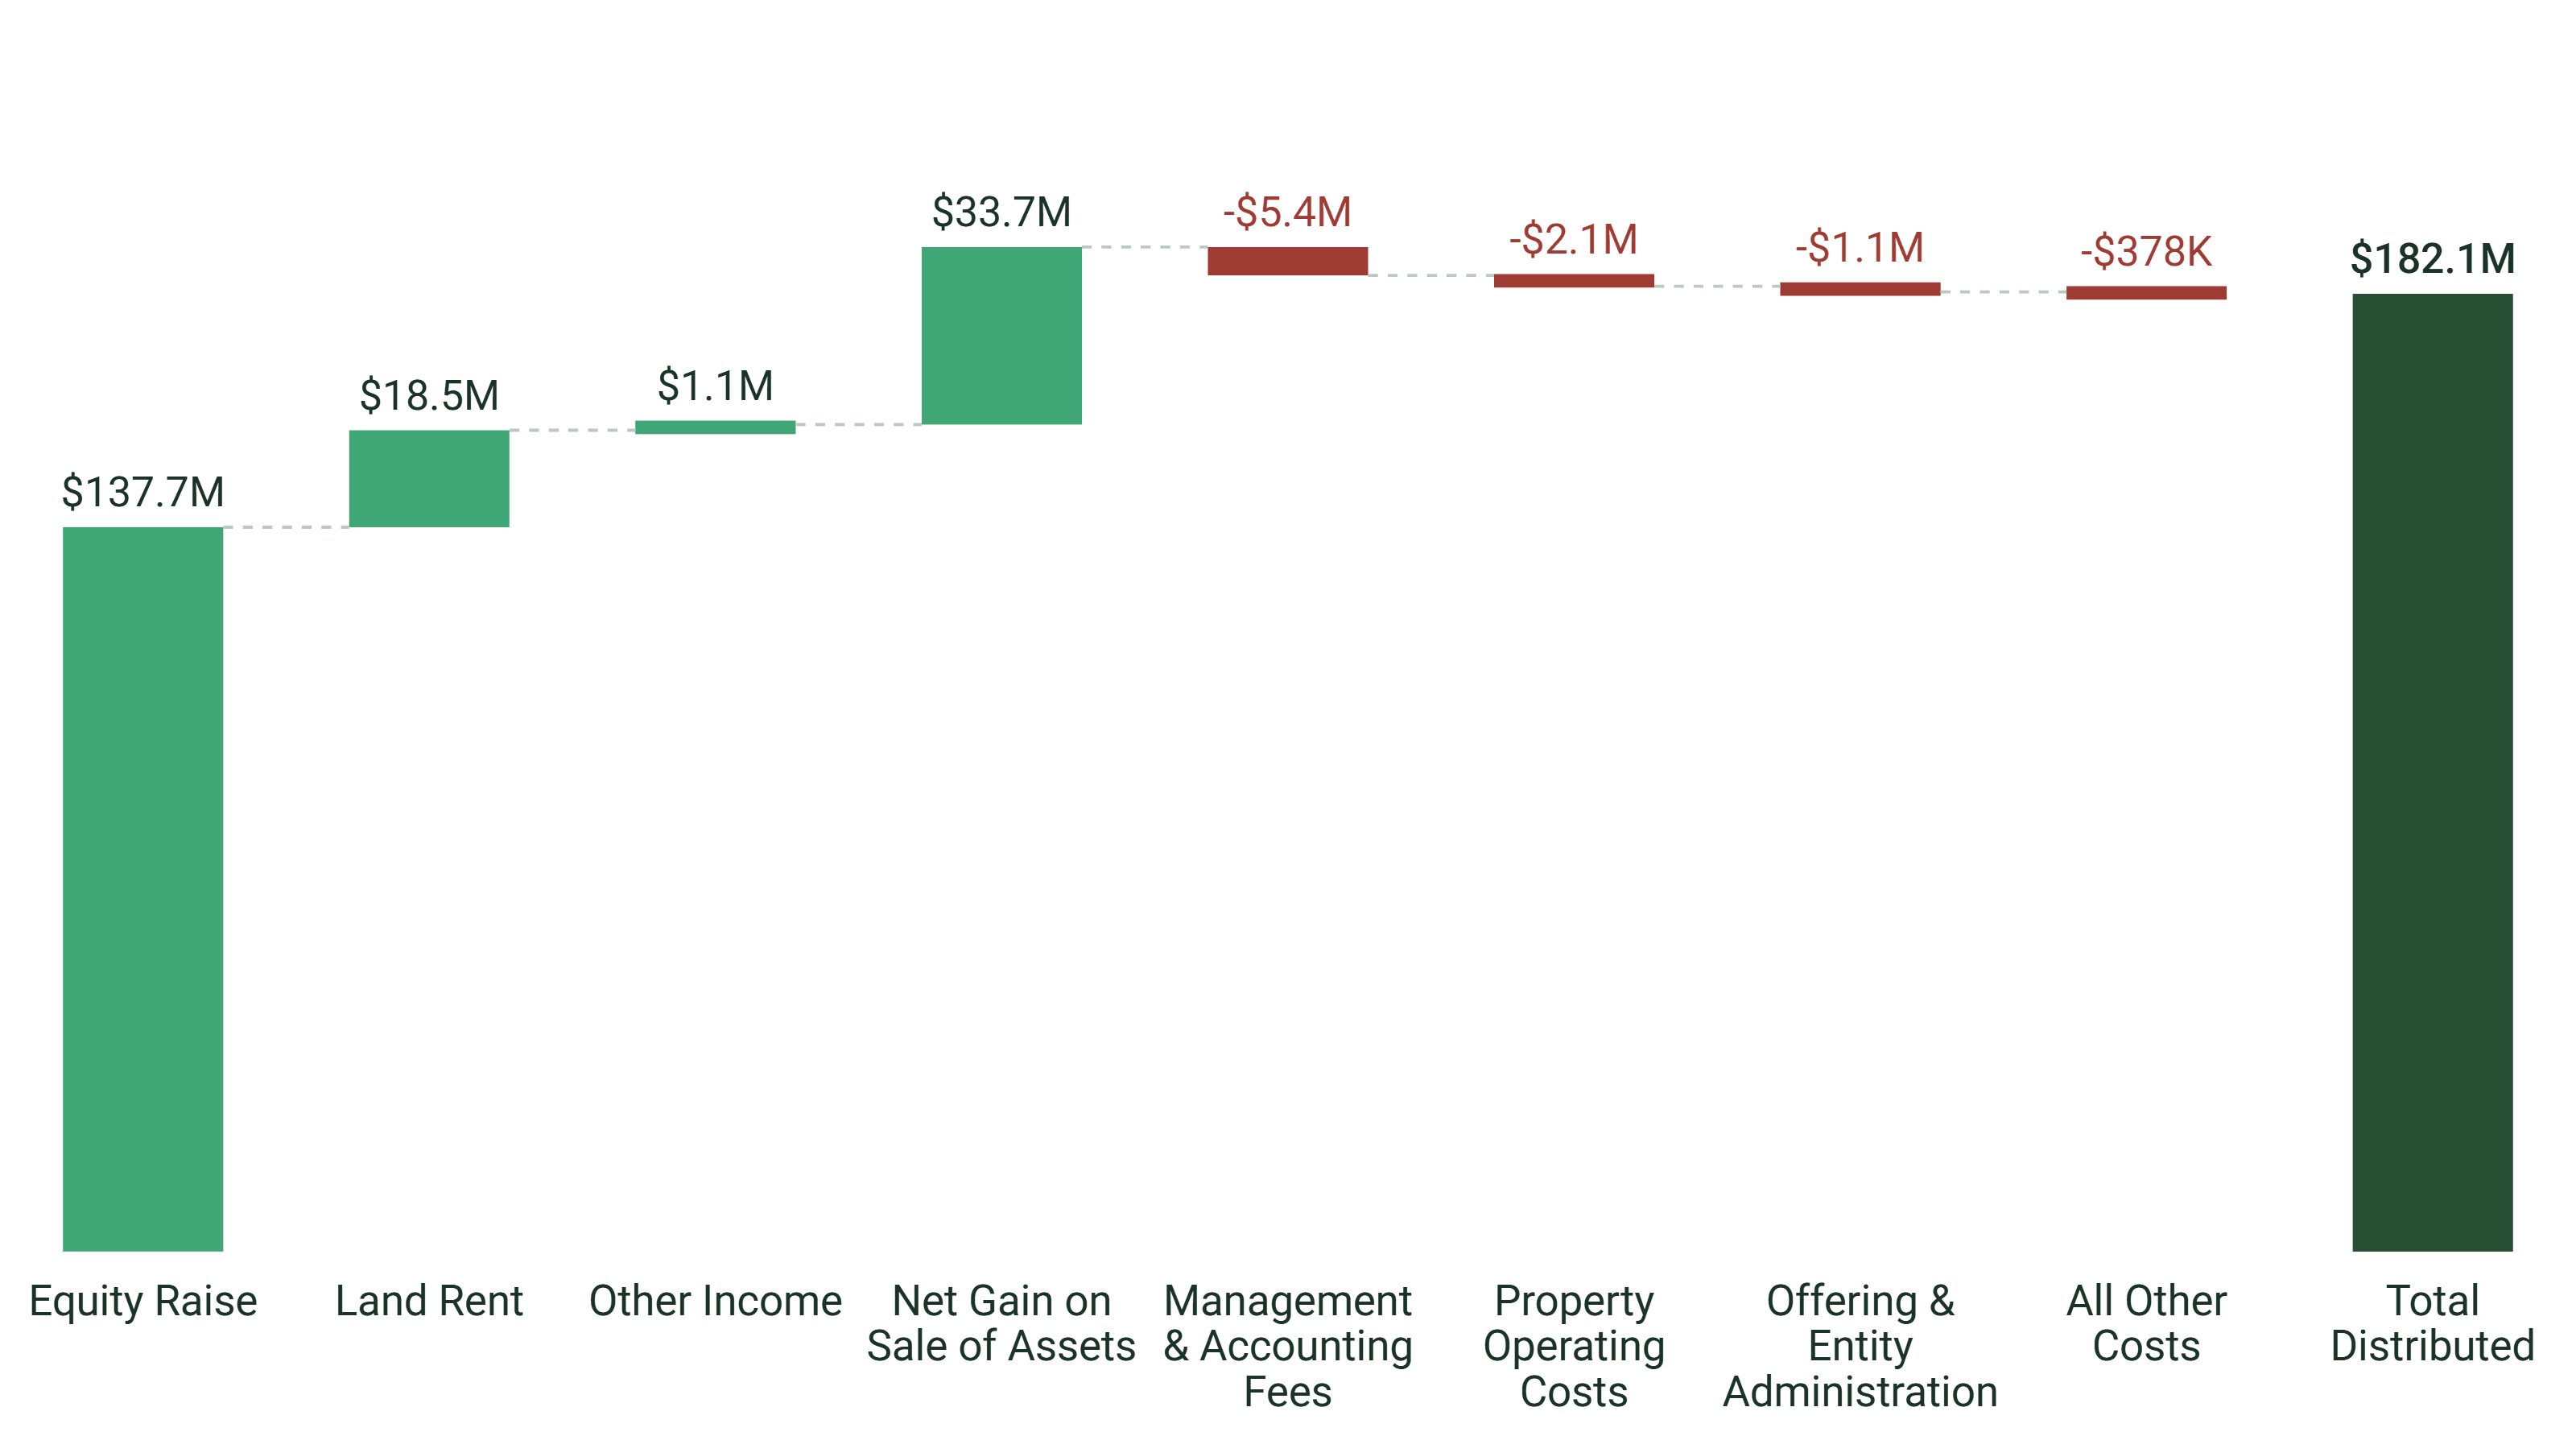
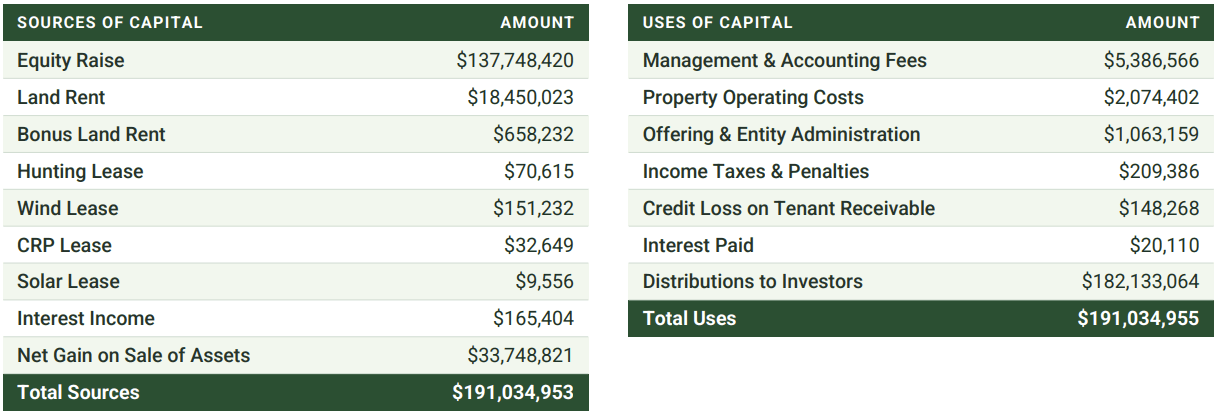
* Total sources and total uses differ by $2. This is a rounding difference arising from the aggregation of 76 separately maintained financials.
Costs are presented in six groups for readability. The walk chart condenses the smaller groups into a single bar so every bar stays legible at portfolio scale. Net gain on sale is shown net of accumulated depreciation of $2,461,649 and net of transaction costs, including the disposition fee, brokerage commission and closing costs, and is the net of gains and losses across the 76 properties. Depreciation is a tax figure consistent with the Schedule K-1.
05 · Benchmark Comparison
BENCHMARKING
Realized performance measured against the NCREIF Farmland Index, the standard institutional benchmark for United States farmland.
ABOUT THE NCREIF FARMLAND INDEX. The National Council of Real Estate Investment Fiduciaries has published a quarterly farmland index since 1991. It is compiled from properties held by institutional investors and reported by the investment managers who hold them, covering several billion dollars of United States farmland. Returns are built from appraised carrying values, not from completed sales.
WHY IT IS THE RIGHT COMPARISON. It is the only widely accepted, independently compiled return series for the asset class, it is reported on the same total-return basis used here, and it is the benchmark institutional allocators already use to evaluate farmland managers. Measuring against it puts this portfolio on the same footing as any other institutional farmland program.
REALIZED NET RETURN AGAINST THE INDEX
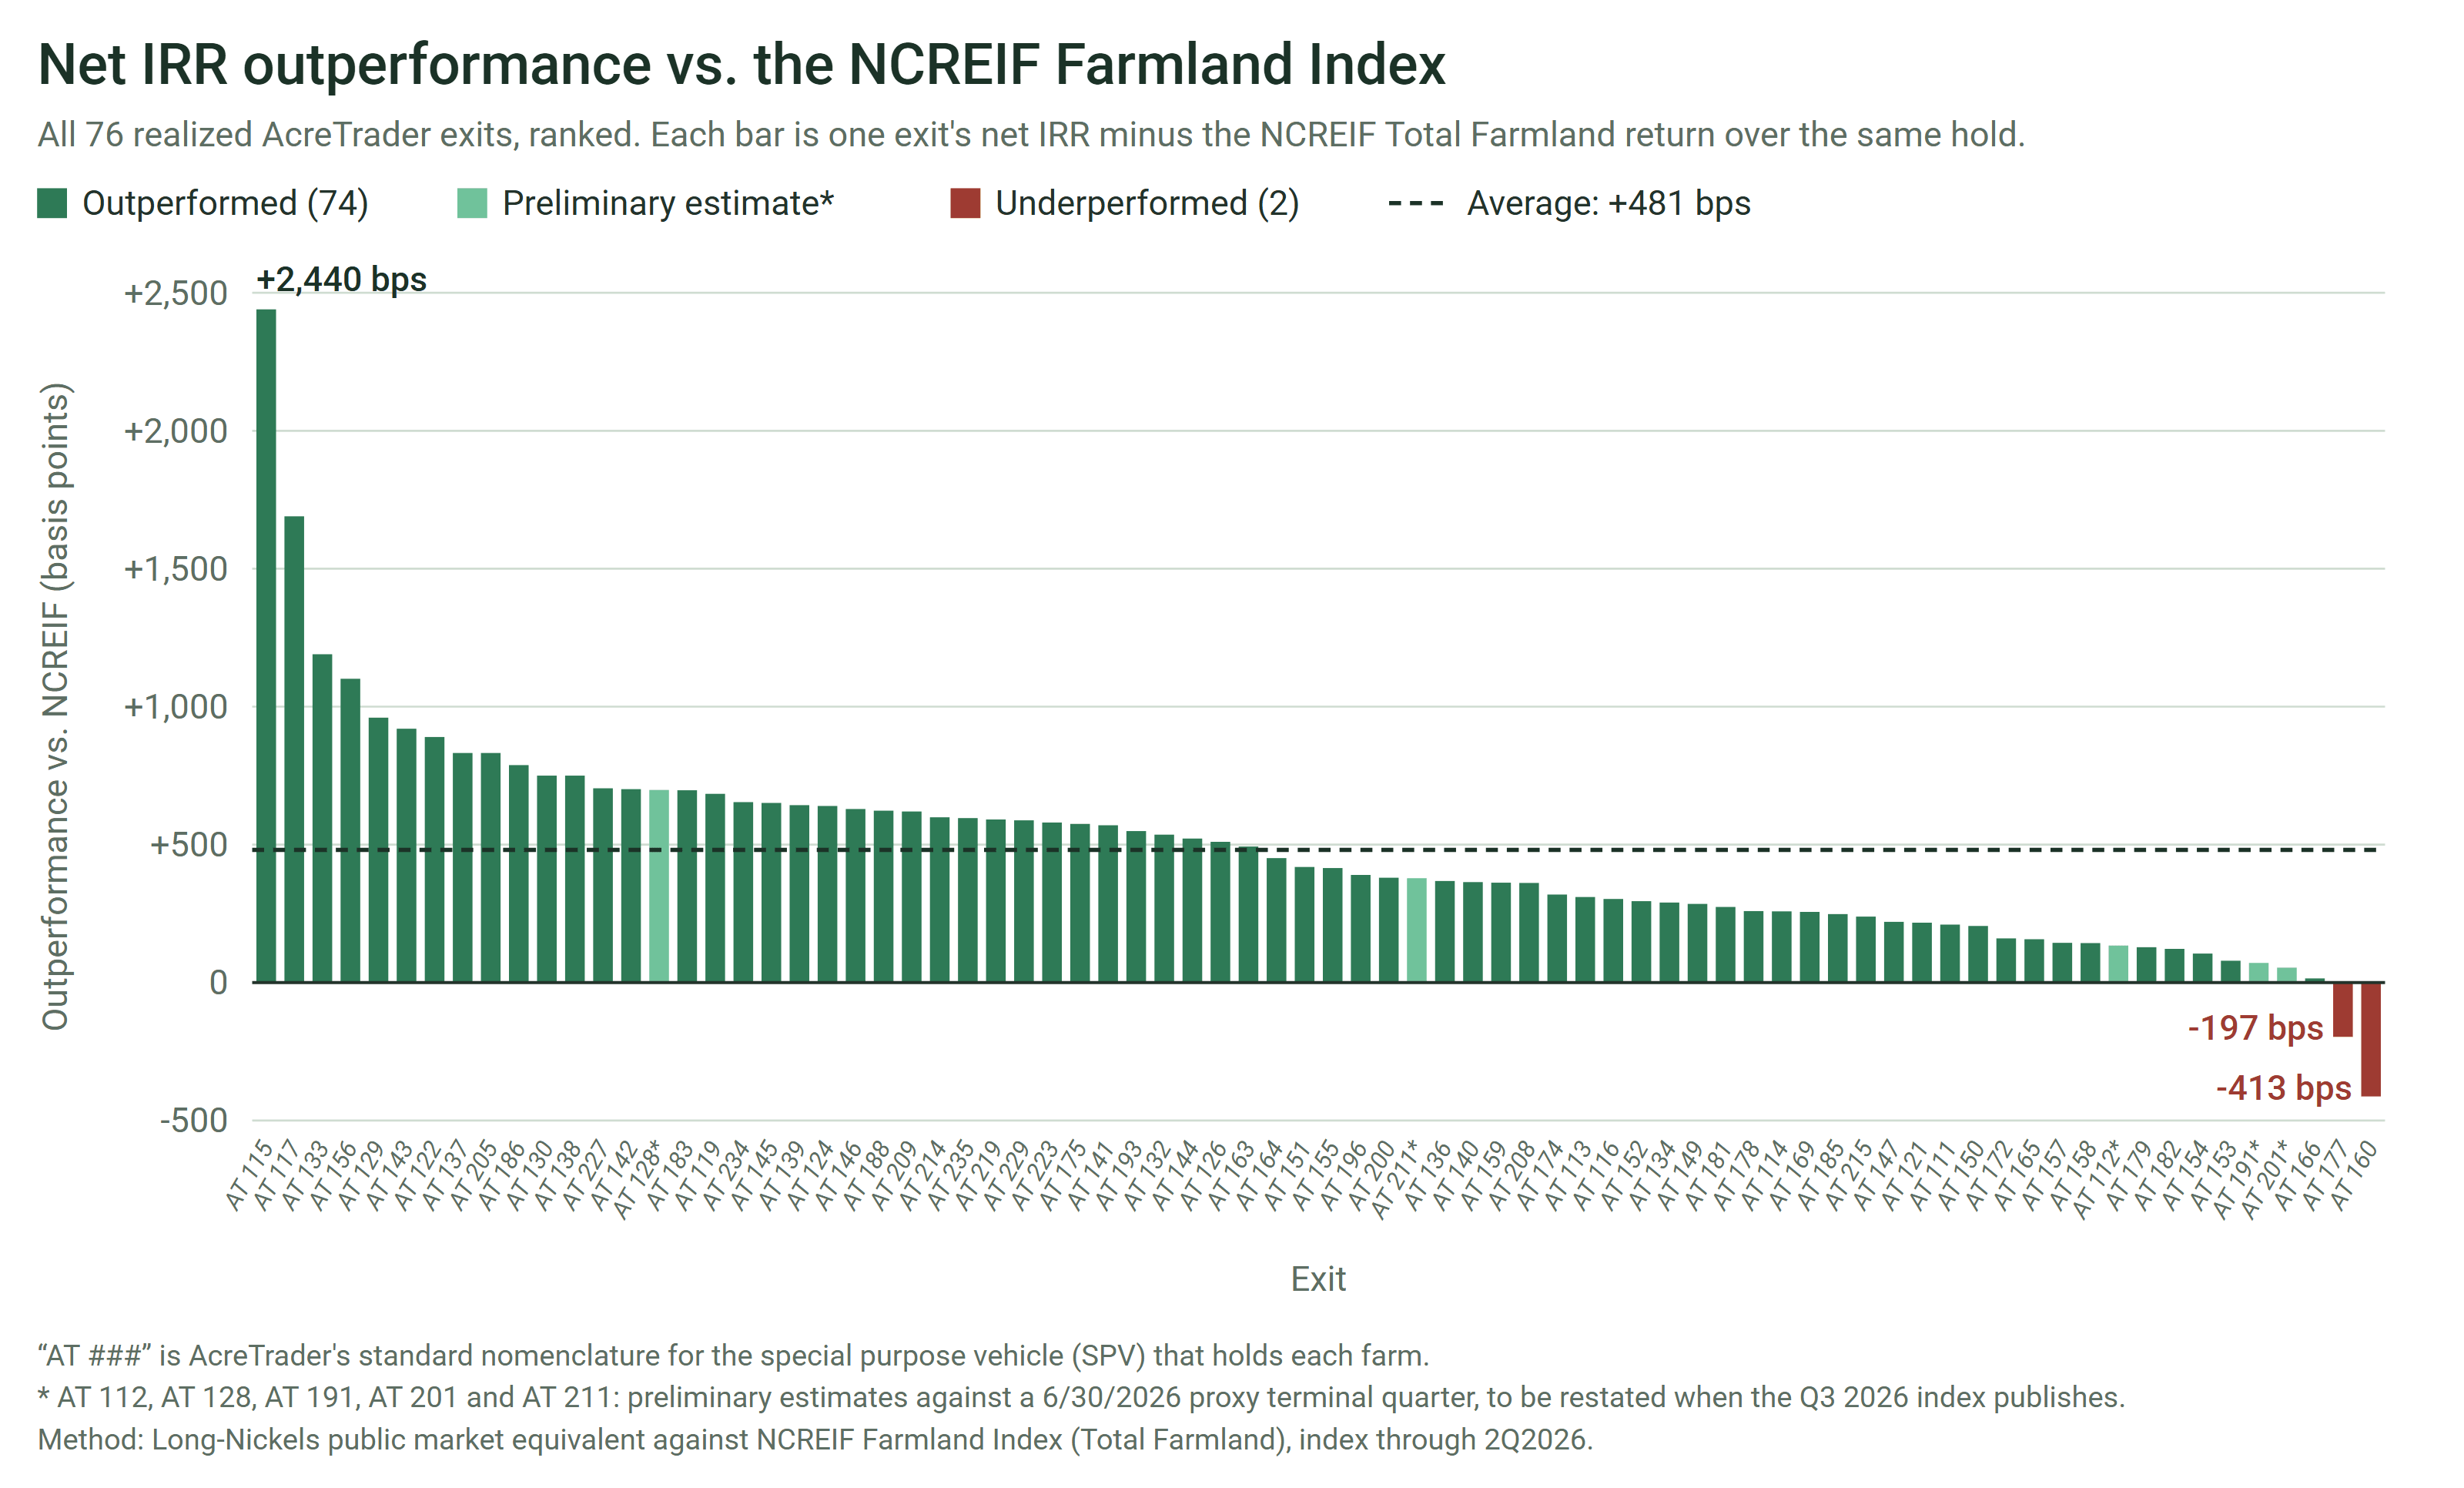
NET AGAINST GROSS. Each investment's net IRR is net of every fee and expense borne by investors, including management fees, accounting fees, syndication costs and all transaction costs incurred when each farm was sold. The index reports gross of the management fees any manager would charge to deliver it and excludes transaction costs altogether, because index returns are constructed from appraised carrying values rather than from completed sales. The outperformance of AcreTrader's investments is therefore stated on a conservative basis; measured on the same terms as the index, the margin would be materially wider.
Index data is the 2Q2026 NCREIF Farmland Index. Comparison uses the Long-Nickels public market equivalent method: index shares are purchased with each farm's equity at its property close quarter, sold to match every actual distribution at that distribution's quarter, and the remainder valued at the final distribution quarter. The resulting series is solved for an internal rate of return and the delta is the farm's realized net internal rate of return less that figure. This is the standard construction for comparing private, irregularly timed cash flows against an index. Portfolio figures in this section are the simple average of the 76 entity-level results. Deltas for AT 112, AT 128, AT 191, AT 201 and AT 211 are estimates: their final distributions fell in a quarter NCREIF has not yet published and will be restated when it does. One basis point is one hundredth of a percentage point.
06 · Operating Performance
OPERATIONS
Rent and net cash yield performance across the hold period, evaluated against original underwriting assumptions.
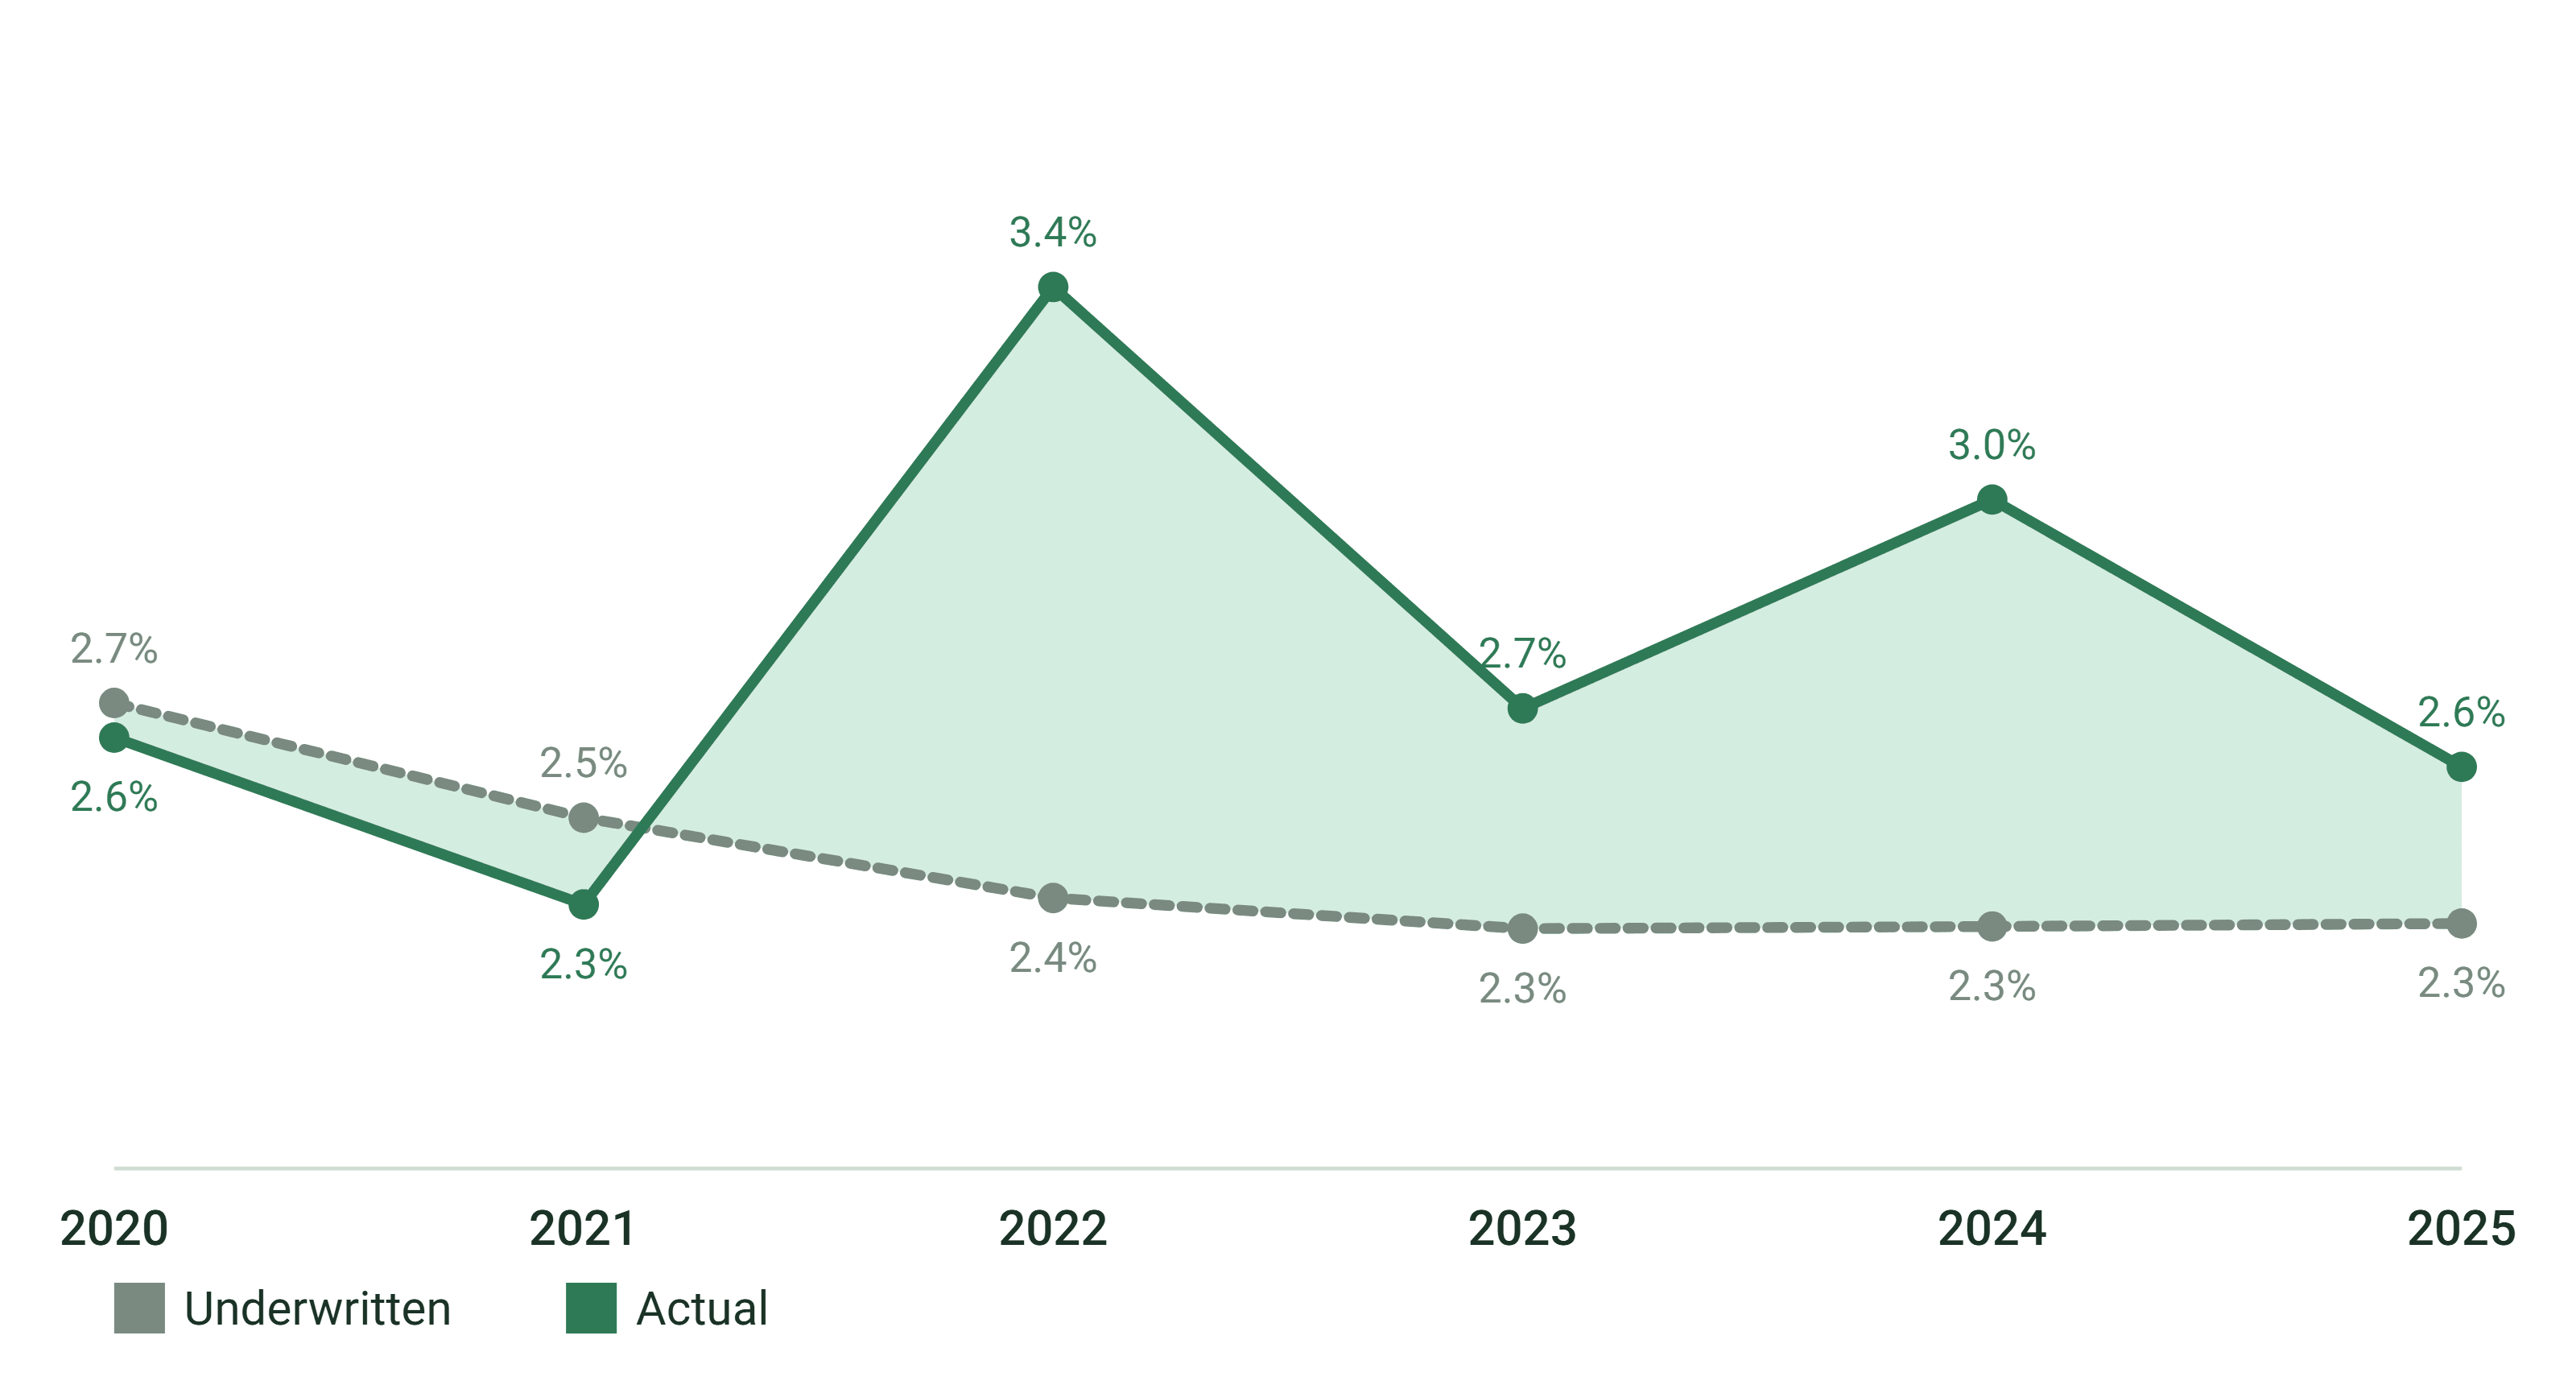
NET CASH YIELD, UNDERWRITTEN AGAINST ACTUAL
OPERATING METRICS
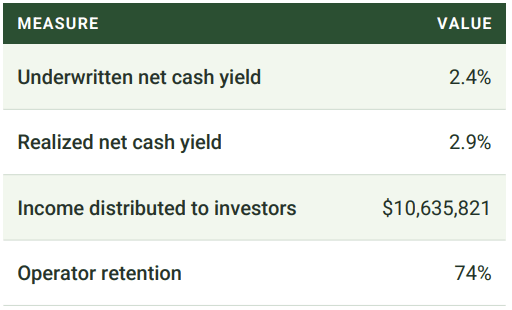

OPERATING RESULT. Actual net cash yield of 2.9% exceeded the underwritten yield of 2.4% across the portfolio. Operating income of $10,635,821 was distributed to investors over the hold period, with 74% of farms retaining the same operator for their entire ownership period. Of the 66 farms that carried an annual valuation mark, 61 sold above that mark and 3 sold at exactly their mark, leaving only 2 that sold below, at a 6.3% premium in aggregate.
Net cash yield measures annual cash distributions, net of operating expenses and reserves, as a percentage of invested capital. The chart shows the portfolio average for each crop year, computed across only the farms active during that year; the composition changes as farms enter and exit the portfolio. Operator retention is measured across each farm's full ownership period. Valuation marks are annual internal valuations prepared for periodic investor reporting. 10 of the 76 exits predate the annual valuation program and are excluded from the mark comparison; the remaining 66 are the latest mark each farm carried before its sale. No farm was remarked in contemplation of a sale.
07 · Asset Management
CAPITAL & LEASING
Capital improvements and partial dispositions across the hold period, and lease operations across the portfolio.

CAPITAL PROJECTS. Capital expenditures were recorded across 42 of the 76 partnerships. Projects ranged from drainage tile installation and levee repairs to irrigation improvements and land clearing. Total invoiced spend of $1,896,183 was broadly in line with the $1,887,500 budgeted.
PARTIAL DISPOSITIONS. Five farms opportunistically sold individual parcels during the hold period, totaling 208.3 acres and $2,176,350 in gross proceeds. These sales were typically small parcels sold to highly motivated buyers on an unsolicited basis. Proceeds were distributed to each farm's investors at the time of sale.
CAPITAL SPEND BY YEAR
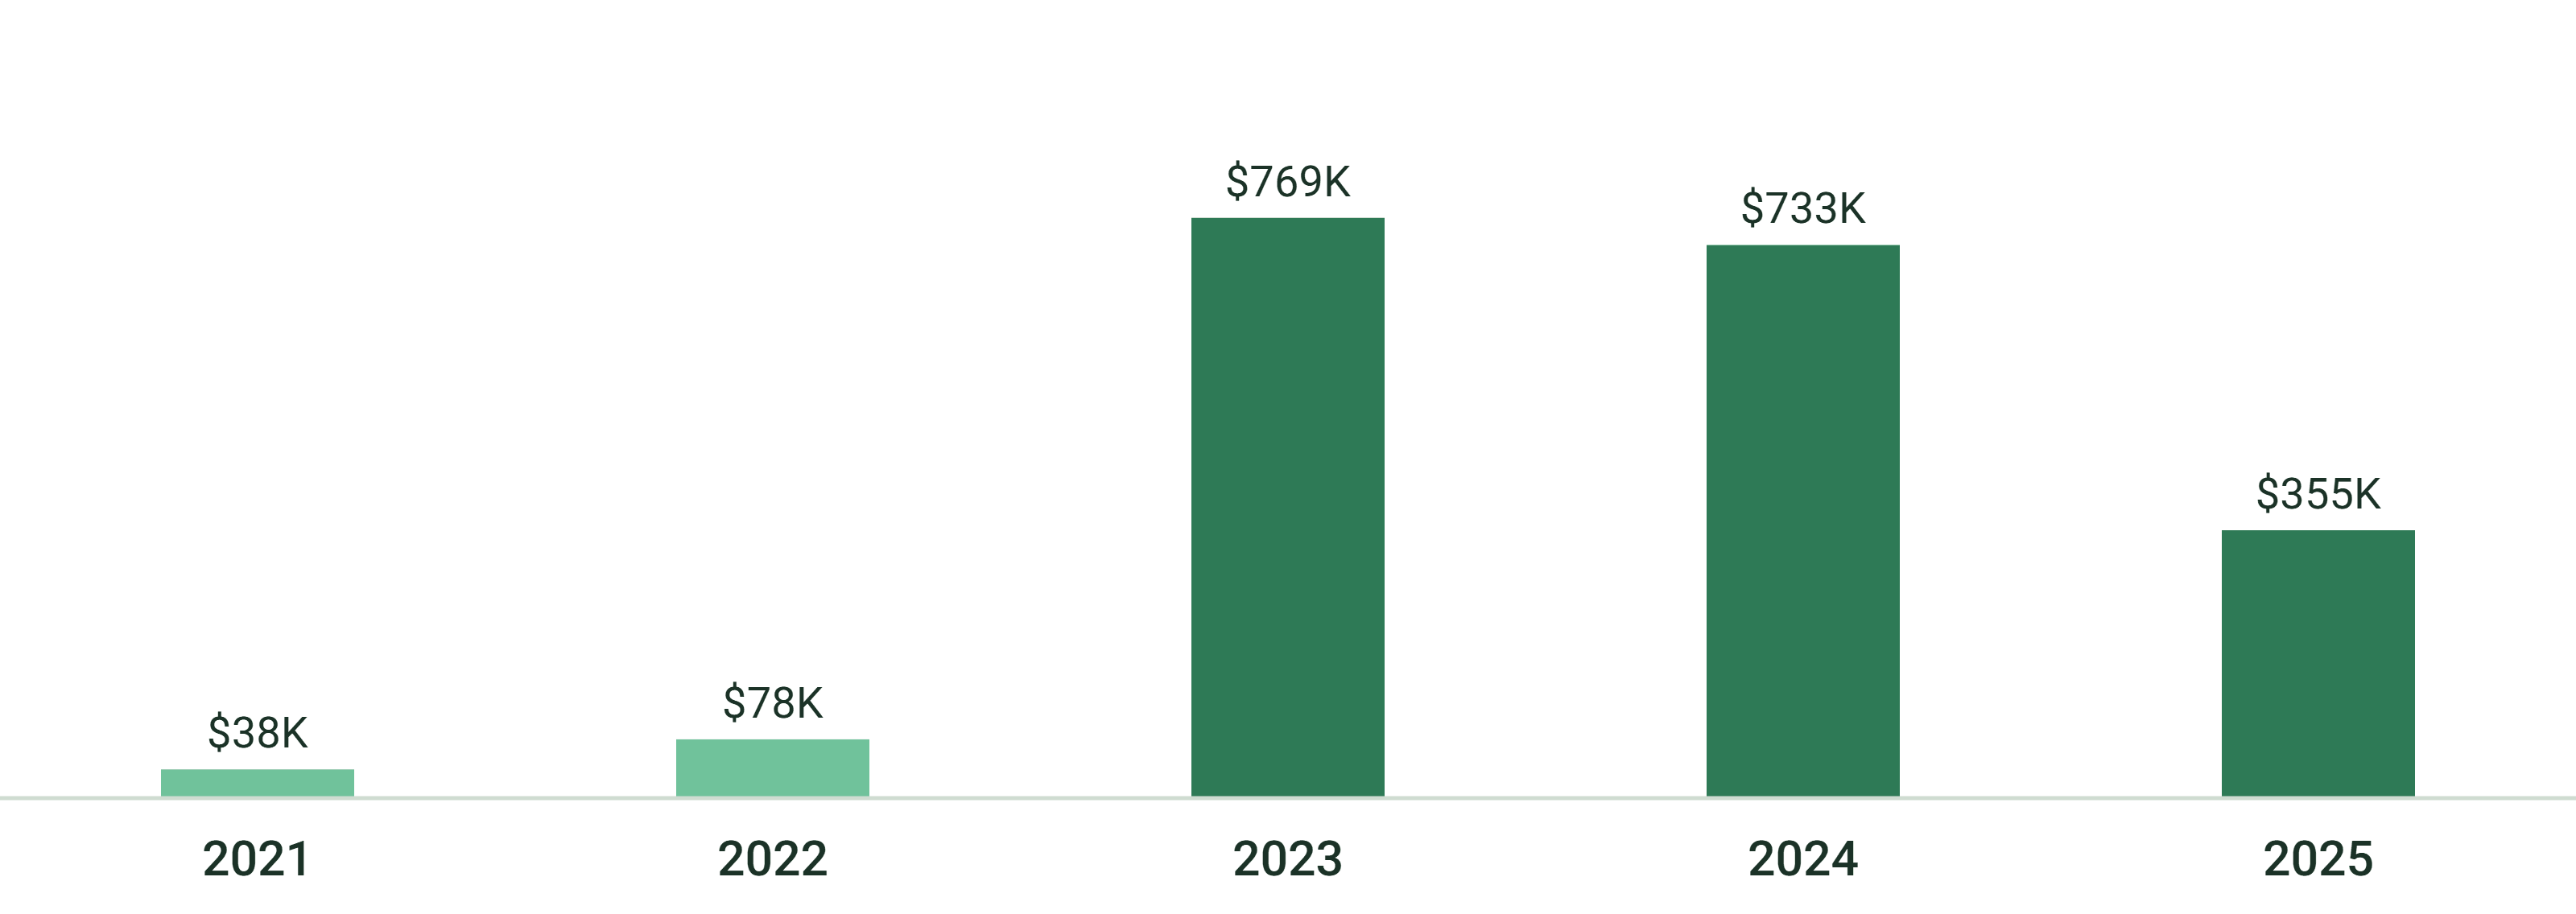
WHERE IT WAS SPENT. Spend concentrated in 2023 and 2024, accounting for 76% of total invoiced capital expenditure and aligning with two to three years before the median exit date. Projects ranged from drainage tile installation and levee repairs to irrigation improvements and land clearing. The vast majority of these costs were capitalized into basis, reducing the gain on sale rather than appearing as an operating expense.
Capital expenditure figures are total amounts budgeted and invoiced across each farm's ownership period. The chart covers 2021 to 2025; a further $3,711 of invoices settled in 2026. Spend concentrated in 2023 and 2024, two to three years before the median exit. Partial disposition proceeds were distributed to each farm's investors at the time of sale and are included in the distributions reported throughout this document.
08 · Realized Performance by Entity
PORTFOLIO SCHEDULE
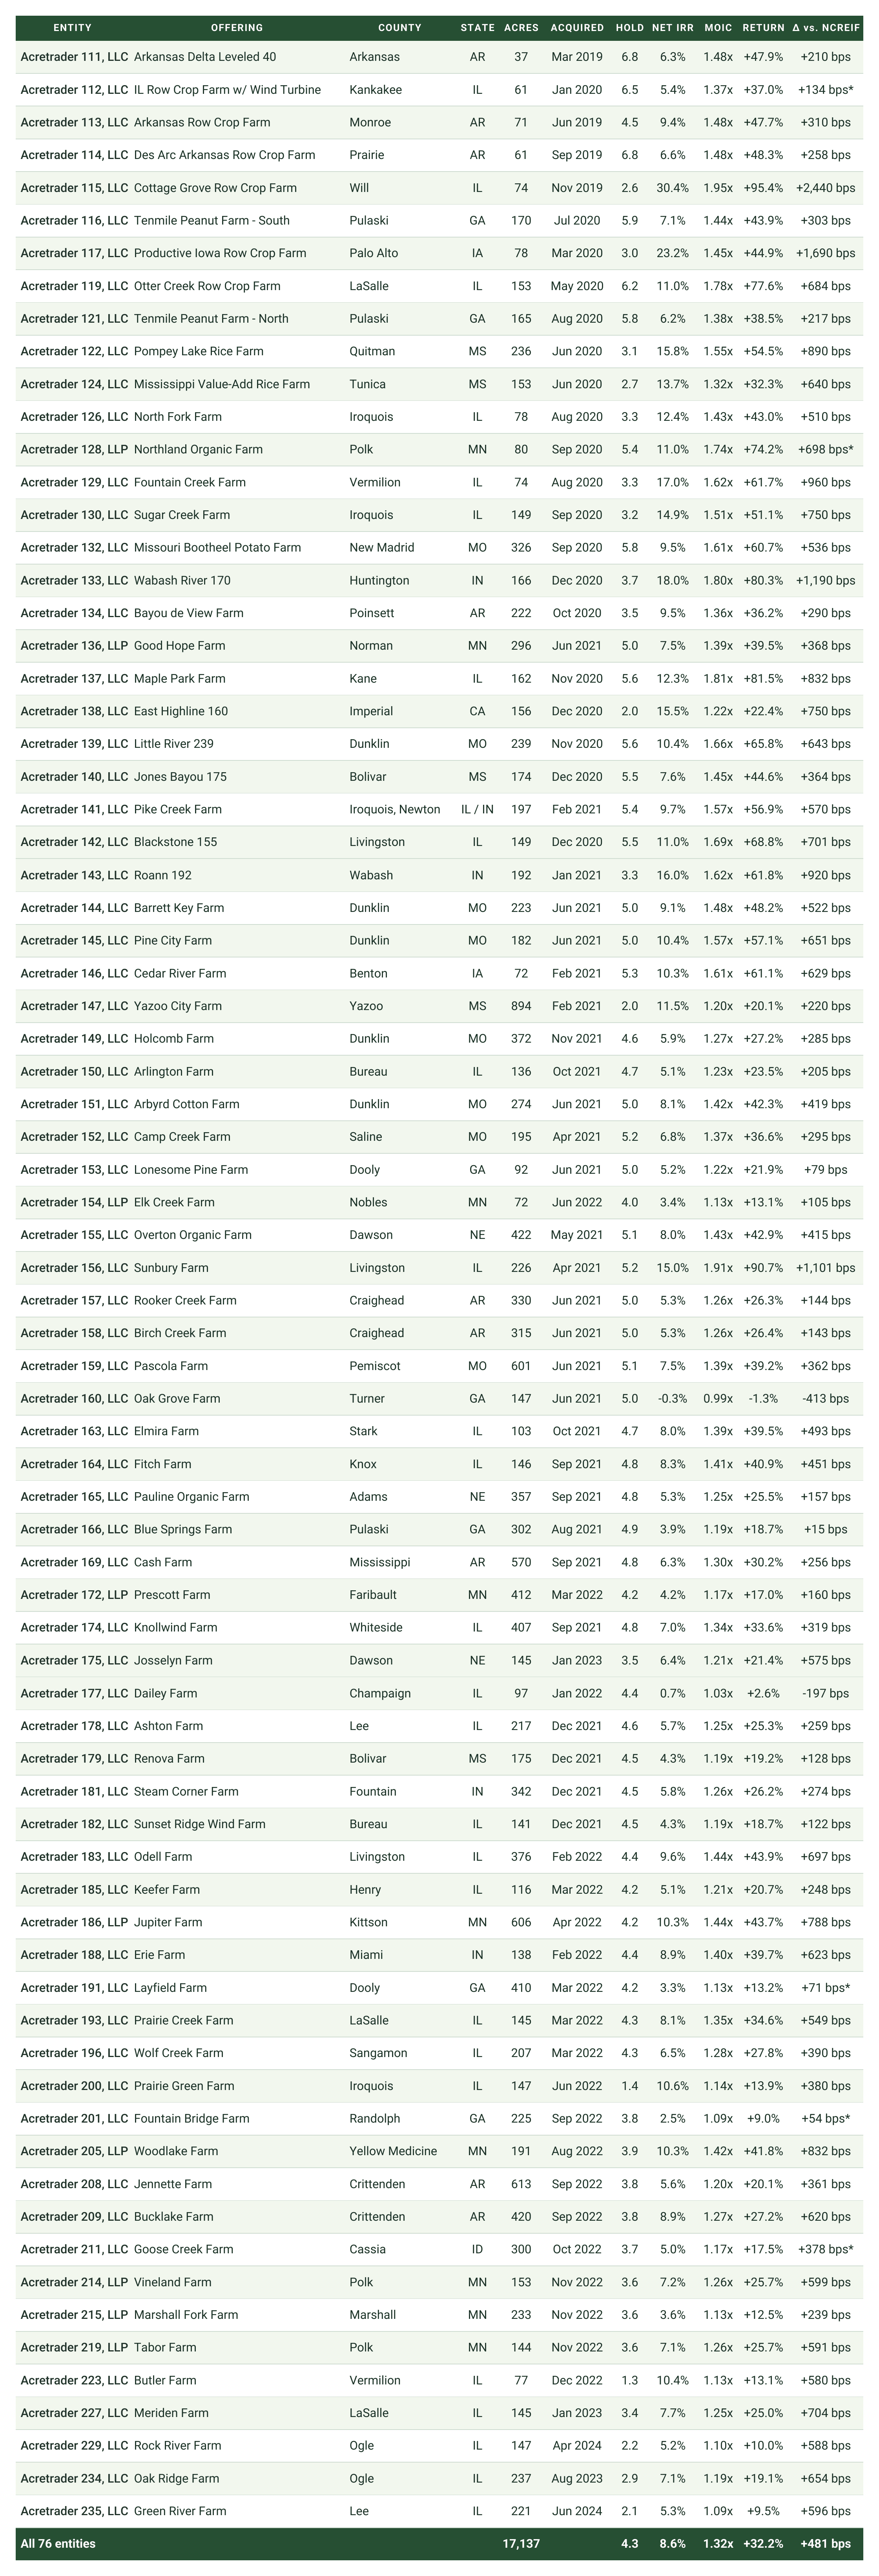
Details for each of the 76 investments, including the farm held and returns delivered, reported on the same basis as the published historical exits schedule.
09 · Definitions and Disclosures
METHODOLOGY
The basis behind every figure in this document.
THE SET. The 76 partnerships whose property sales have settled as of August 2026, encompassing all AcreTrader-managed row crop farm exits to date.
NET IRR. Realized internal rate of return to investors, net of all fees and expenses, from the property purchase settlement to the final distribution of capital. Portfolio figures are the simple average of the 76 entity-level results unless stated otherwise. Entity-level returns may differ from any individual investor's return.
HOLD PERIOD. Property purchase settlement to final distribution of capital, a simple average of 4.3 years.
MOIC. Total distributed divided by equity raised, 1.32x across the portfolio.
NCREIF BENCHMARK. Each entity's net IRR is compared to the NCREIF Farmland Total Return Index over the matching holding period. The delta is stated in basis points. AcreTrader returns are net of all fees; the index is gross. Deltas marked with an asterisk (AT 112, AT 128, AT 191, AT 201 and AT 211) are preliminary: these farms initiated their final distribution in Q3 2026, which NCREIF has not yet published, so the delta is estimated against a proxy terminal quarter and will be updated once the Q3 2026 index is released.
EQUITY RAISED. The aggregate equity raised across the 76 partnerships, $137,748,420.
DISTRIBUTIONS. Total distributed of $182,133,064 reflects gross distributions to investors, inclusive of state tax amounts paid on their behalf, and comprises $10,635,821 of operating income and $171,497,243 of disposition proceeds. It reflects gross distributions, not net sale proceeds.
PURCHASE PRICE AND EQUITY. Purchase price of $132,403,398 is the price paid for land. Equity raised of $137,748,420 is higher due to transaction costs, improvement capital expenditures, and working capital.
PORTFOLIO SCHEDULE. Section 08 lists all 76 entities individually. Entity names carry the LLC or LLP suffix each vehicle was formed under. 'Acres' are tillable acres and 'Acquired' is the property purchase settlement month; 'Hold' represents real estate close to the final distribution of capital. 'Net IRR' (internal rate of return), 'MOIC' (return on capital) and 'Return' (total return) are entity-level figures net of all fees and expenses. The final row states total tillable acres and portfolio return on capital, with hold period, net internal rate of return and delta as simple averages across the 76. One farm straddles the Illinois and Indiana line and is shown as IL / IN.
IMPORTANT DISCLOSURES. Past performance is no guarantee of future results. This document describes realized outcomes for farmland partnerships and is provided for informational purposes only. It is not an offer to sell or a solicitation of an offer to buy any security, and nothing in it constitutes investment, tax or legal advice. Individual investor returns may differ from entity-level returns shown here based on the timing and size of each subscription. Securities previously offered through North Capital Private Securities Corporation, member FINRA / SIPC. Investments in private placements are speculative, illiquid and may result in the complete loss of capital.
112 W Center Street, Suite 600 · Fayetteville, Arkansas 72701 · As of August 2026

Managing Director
Drew Lipke joined AcreTrader in 2021 and serves as Managing Director, leading the sourcing and underwriting of farms acquired and managed by AcreTrader LLC. Drew brings more than 14 years of experience across debt and equity capital markets, including roles in corporate credit analysis, equity research, and institutional equity sales. Prior to AcreTrader, Drew spent 12 years at Stephens Inc. covering multiple sectors including aerospace and defense, energy exploration and production, and building materials and construction services, and later served as Managing Director of corporate credit analysis at a fixed-income broker dealer. A Little Rock native, Drew has owned farmland in Arkansas for over a decade. He holds Series 7, 24, 63, 79, 86, and 87 licenses with FINRA and is a registered representative of North Capital Private Securities. Drew earned his degree from the University of Georgia’s Terry College of Business and was recognized by Institutional Investor as an All-America Research Team Rising Star.