
Mid-Year 2026 Farmland Values Review - The Importance of Inefficiency in Farmland
Key Points:
- Reviewing USDA land values as of June 30, 2026 vs. reported transaction data
- A data-driven review of Class A and Class B cropland values over the last 8.5 years in Illinois and Iowa
- The wide dispersion in farmland values drives opportunity
While distilling farmland values and returns to a single index is helpful to see big picture trends, the reality in practice is significantly more nuanced. We believe opportunity lies in understanding the nuance and capitalizing on the inherent inefficiencies of each local market. In the article below we compare the broad trends of USDA data to actual transactions at a more localized level. Cropland is not homogeneous and the market is highly inefficient in practice. There is no central clearinghouse or marketplace where transactions are reported in real time. This inefficiency is one of the key drivers of farmland returns.
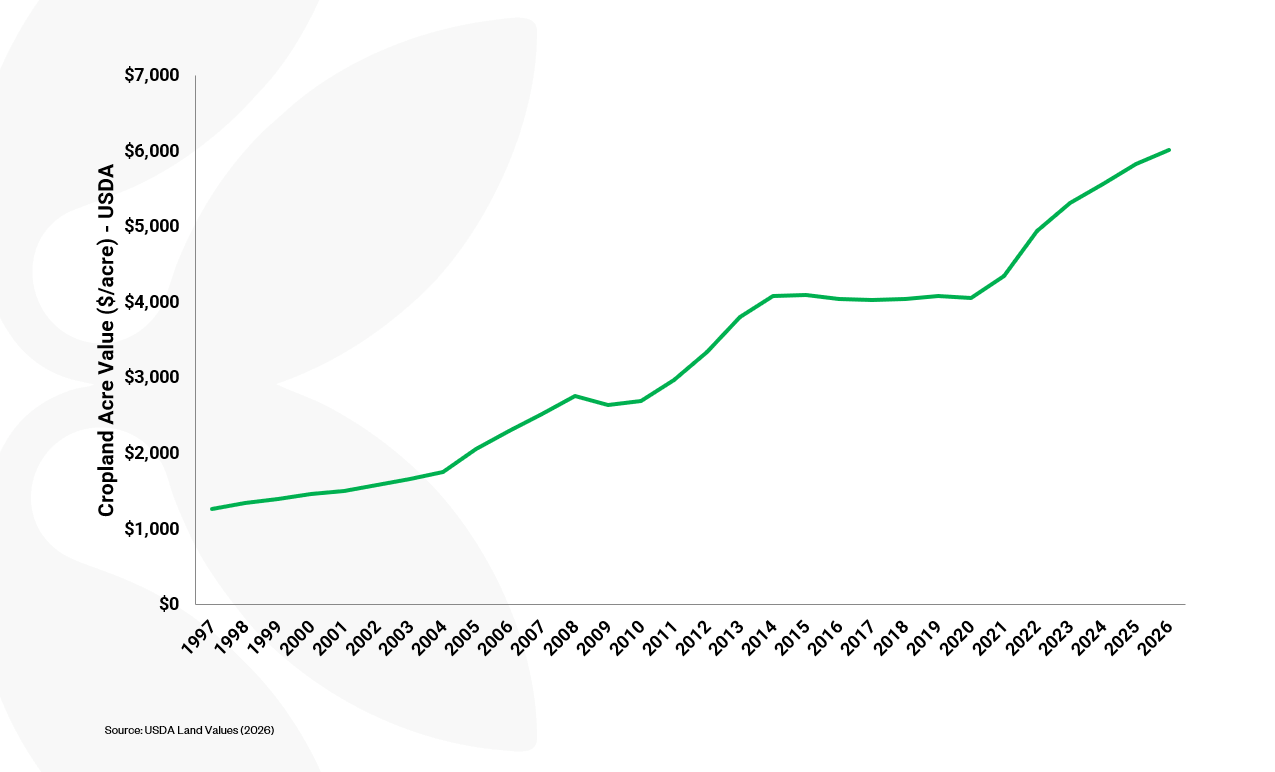
The USDA released its annual Land Values Summary report for cropland. According to the USDA, the average value of U.S. cropland increased $190 per acre to $6,020 per acre, an increase of 3.3% year-over-year. From 1998-2026, U.S. cropland values have increased by 5.6% on average annually.
Figure 1 - U.S. Cropland Values
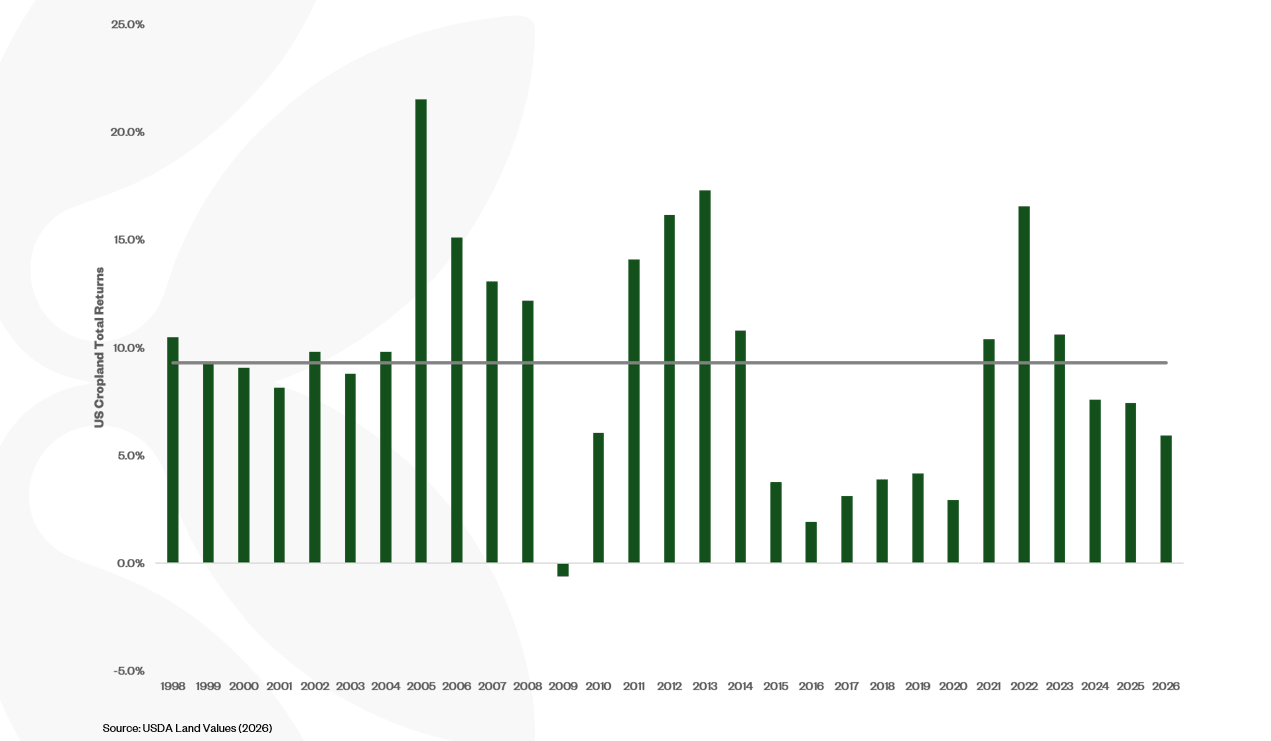
When factoring in cash rent as a proxy of income, the total annual return for U.S. cropland in 2026 was 5.9%, compared to the 1998-2026 average of 9.3%.
Figure 2 - U.S. Cropland Total Returns
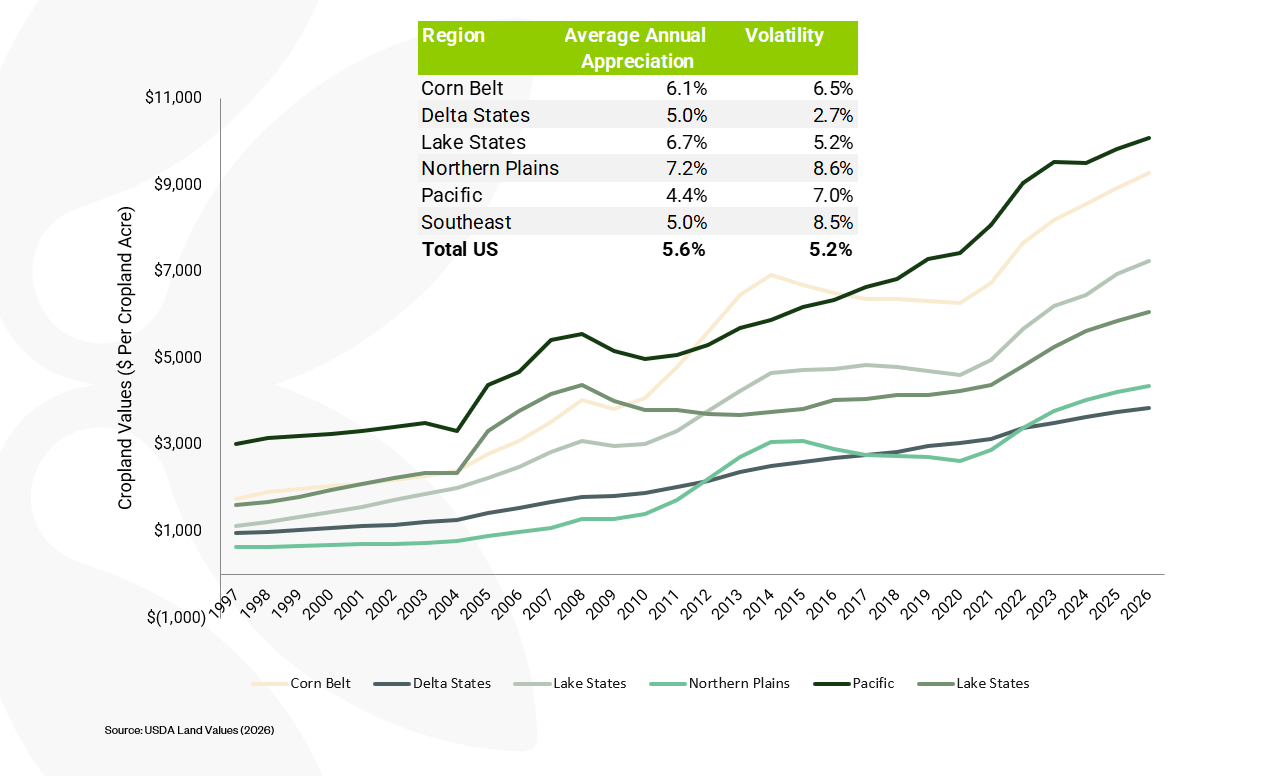
Farmland markets across the country vary significantly, though as shown in Figure 3, the general trend of mid-single-digit % average annual appreciation with limited volatility holds across each region overall.
Figure 3 - USDA Cropland Values by Region
Comparing Survey Data to Transaction Data
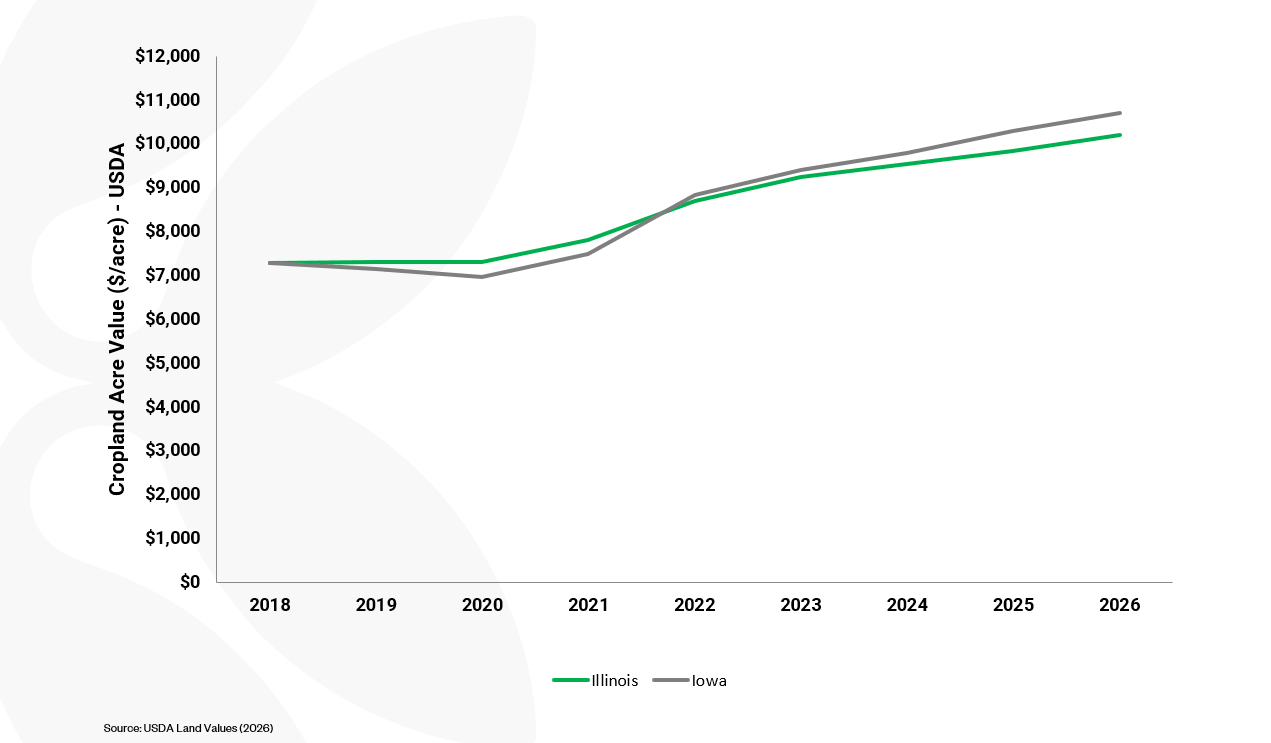
To make a comparison to USDA data, we examine the states of Iowa and Illinois. According to the USDA, as of June 30, 2026 cropland values in Illinois increased 3.6% year-over-year, while cropland values in Iowa increased 3.9% year-over-year.
Figure 4 - USDA Cropland Values in Illinois and Iowa
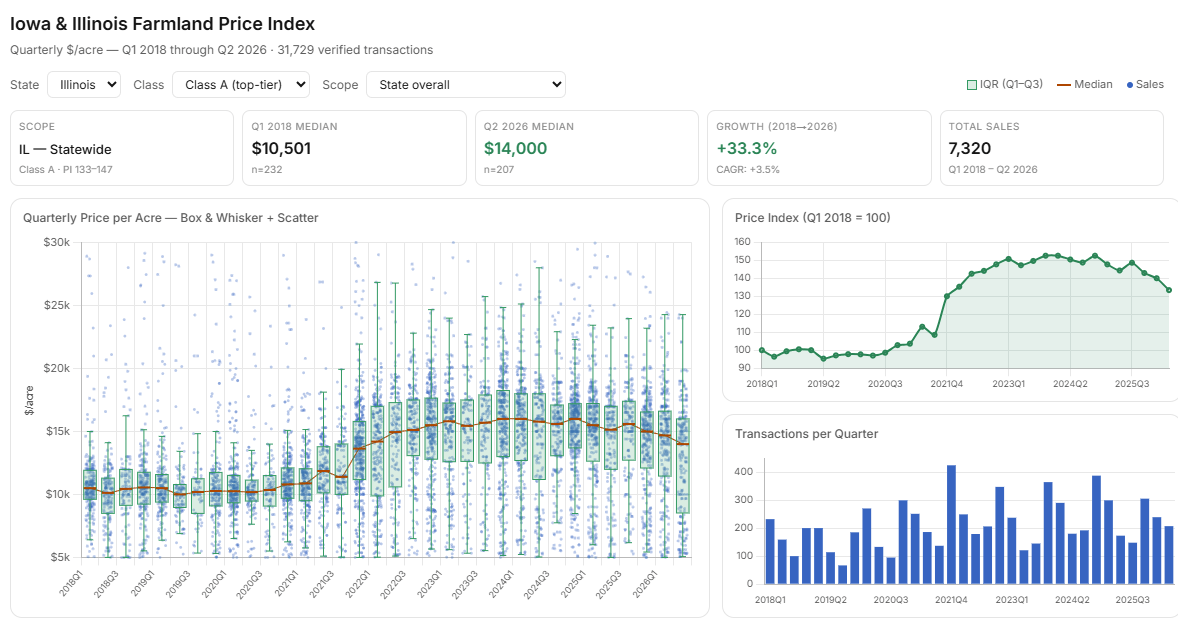
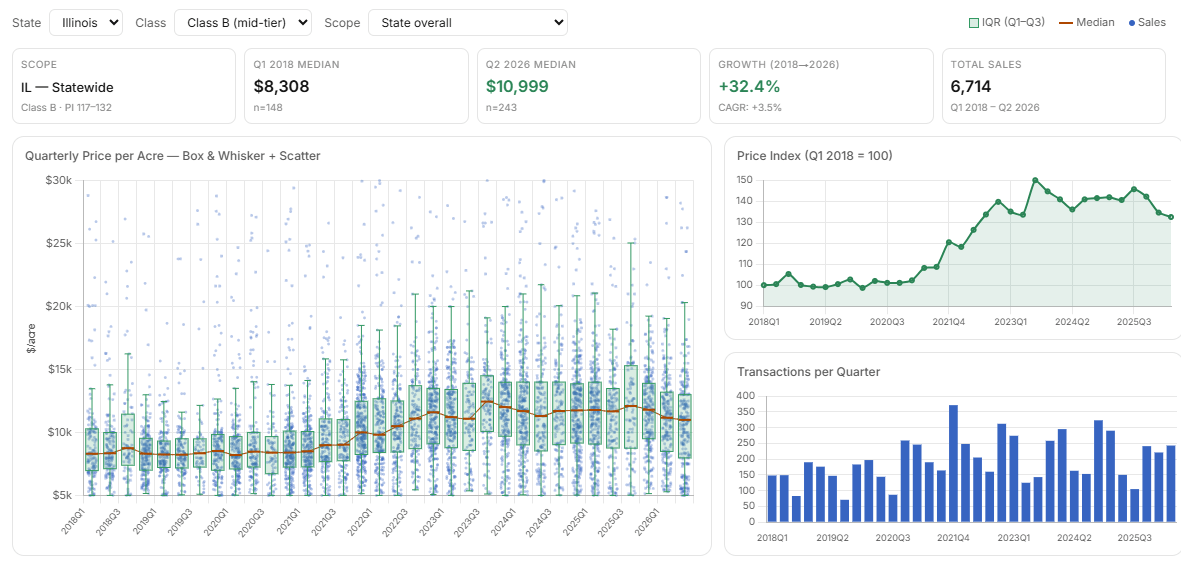
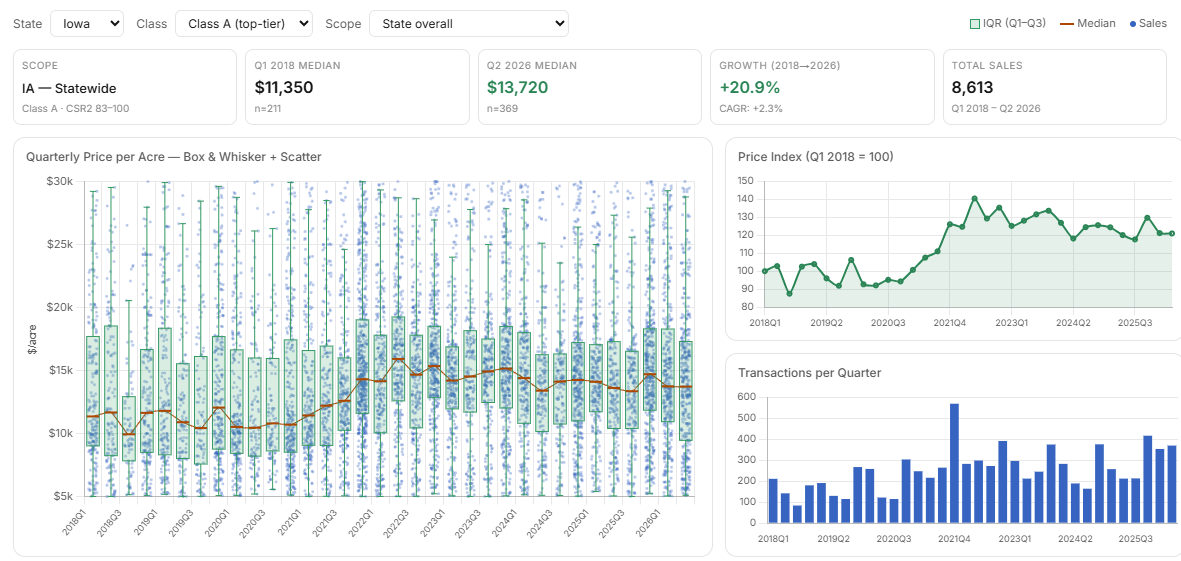
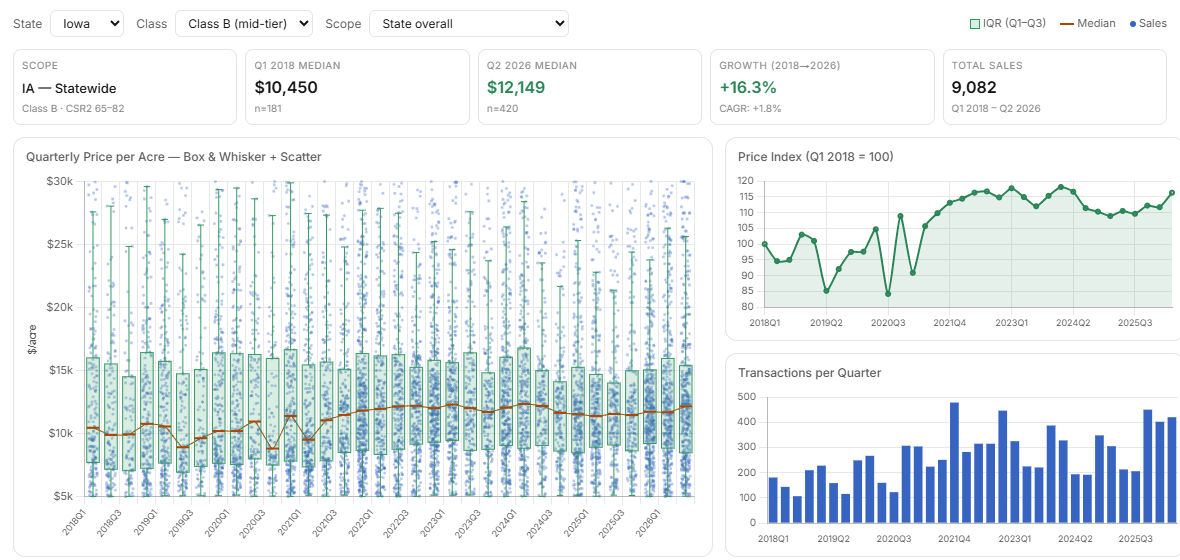
When we review the transaction data for cropland in Illinois and Iowa, it paints a much more varied and nuanced picture. In the figures below, we plot out 31,729 transactions for Class A and Class B farmland across the last 8 years in the states of Iowa and Illinois, which are two of the most homogenous farmland markets in the country to 1) distill trends based on actual transactions and 2) demonstrate the incredibly wide dispersion among transactions. Each dot represents a single farmland transaction, while the boxes represent 25th-75th percentile to demonstrate the interquartile range each quarter. The transactions have been filtered to only include transactions over 30 acres with no improvements. In addition, the transactions only include Class A and Class B farmland as defined by the soil productivity rating (PI or CSR2) to only encompass cropland transactions. Note that this data set begins in Q1 2018, whereas the USDA Cropland value reports date back to 1997.
As of Q2 2026, the median price for Class A farmland in Illinois stood at $14,000 per acre. That represents an (8%) year-over-year decrease from Q2 2025 and a 33.3% increase from Q1 2018. Most importantly, the interquartile range increased significantly in Q2 2026 to $7,471 per acre, the largest of any quarter in the data set. This means that 50% of transactions fell between $8,529 per gross acre and $16,000 per gross acre. This is in line with the trends we are seeing in real time in our everyday sourcing. Each local market presents a wide range of potential opportunities of which disciplined underwriting can take advantage.
Figure 5 - Illinois Class A Farmland Transactions
 Source: Acres, AcreTrader
As of Q2 2026, the median price for Class B farmland in Illinois stood at $10,999 per acre. That represents a (6%) year-over-year decrease from Q2 2025 and a 32.4% increase from Q1 2018. The interquartile range in Q2 2026 again showed wide dispersion per acre of $5,020, implying 50% of all transactions ranged from $7,980 per acre to $13,000 per acre.
Figure 6 - Illinois Class B Farmland Transactions
 Source: Acres, AcreTrader
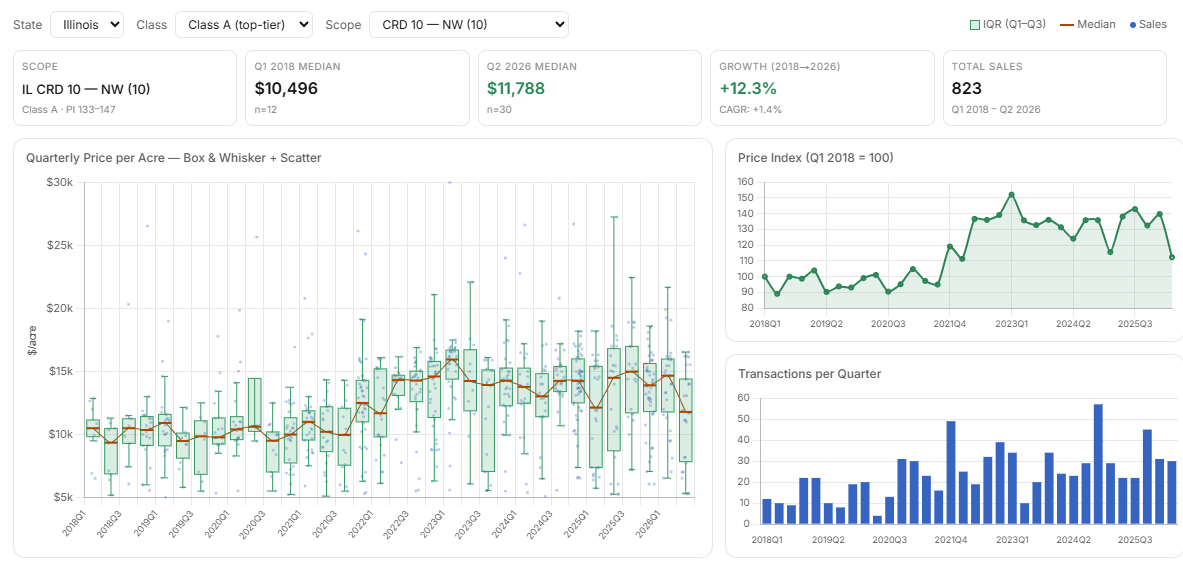
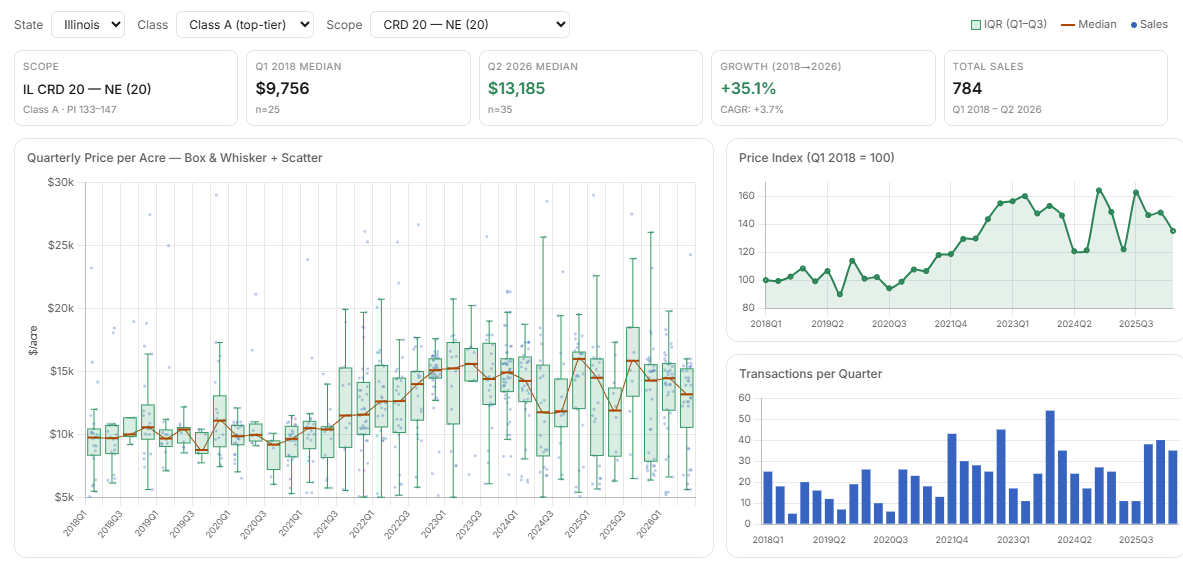
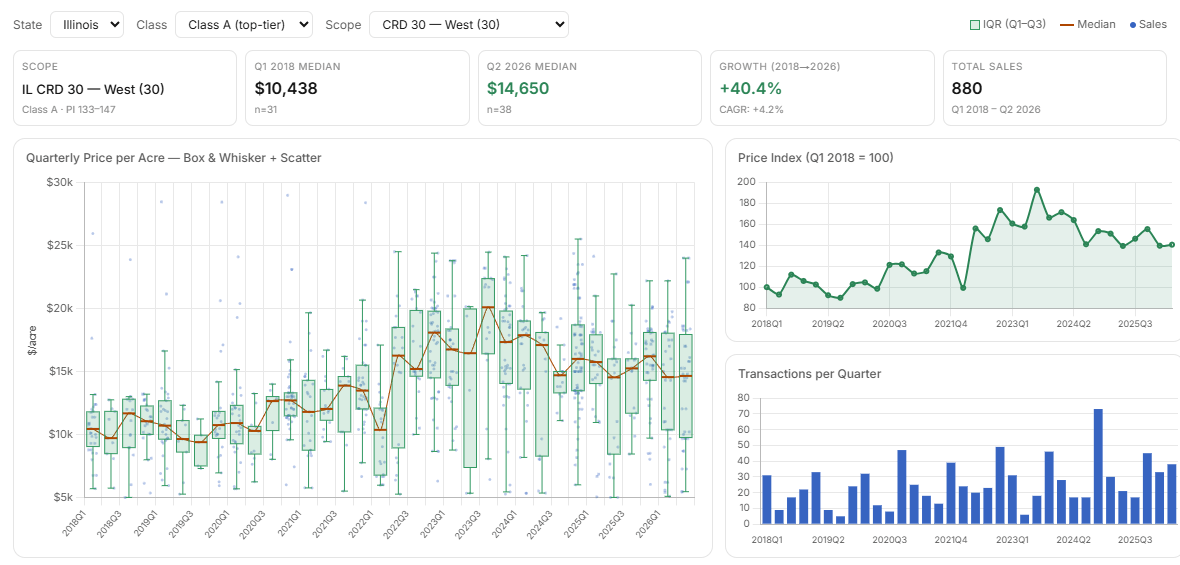
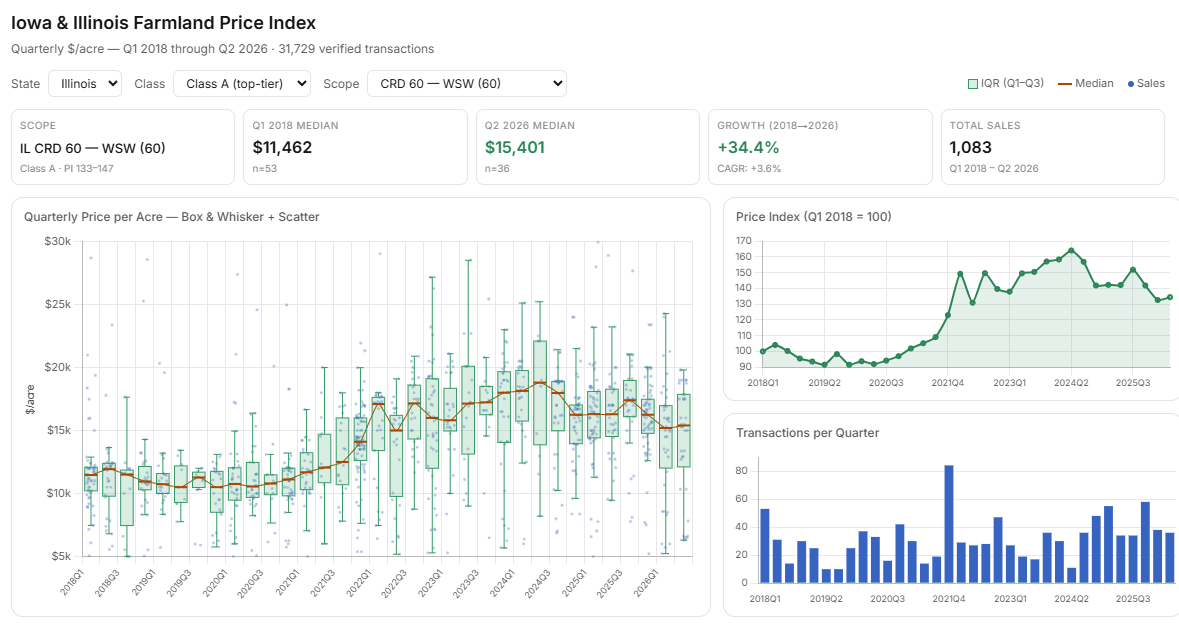
These same trends hold across Illinois when looking at Class A and Class B cropland broken down by crop reporting district (CRD). Over the last year in Illinois we have seen a softer market, and we update our offer prices in real time to reflect these trends and remain disciplined.
Figure 7 - Illinois Class A Farmland by CRD
 Source: Acres, AcreTrader
 Source: Acres, AcreTrader
 Source: Acres, AcreTrader
 Source: Acres, AcreTrader
The state of Iowa paints a more resilient picture for median farmland values, though maintains the same significant spread around median values. As of Q2 2026, the median price for Class A farmland in Iowa stood at $13,720 per acre. That represents a 1% year-over-year increase from Q2 2025 and a 20.9% increase from Q1 2018. The interquartile range in Q2 2026 again showed wide dispersion per acre of $7,850, implying 50% of all transactions ranged from $9,453, per acre to $17,303 per acre.
Figure 8 - Iowa Class A Farmland Transactions
 Source: Acres, AcreTrader
As of Q2 2026, the median price for Class B farmland in Iowa stood at $12,149 per acre. That represents a 5% year-over-year increase from Q2 2025 and a 16.3% increase from Q1 2018. The interquartile range in Q2 2026 again showed wide dispersion of $6,924 per acre, implying 50% of all transactions ranged from $8,461 per acre to $15,385 per acre.
Figure 9 - Iowa Class B Farmland Transactions
 Source: Acres, AcreTrader
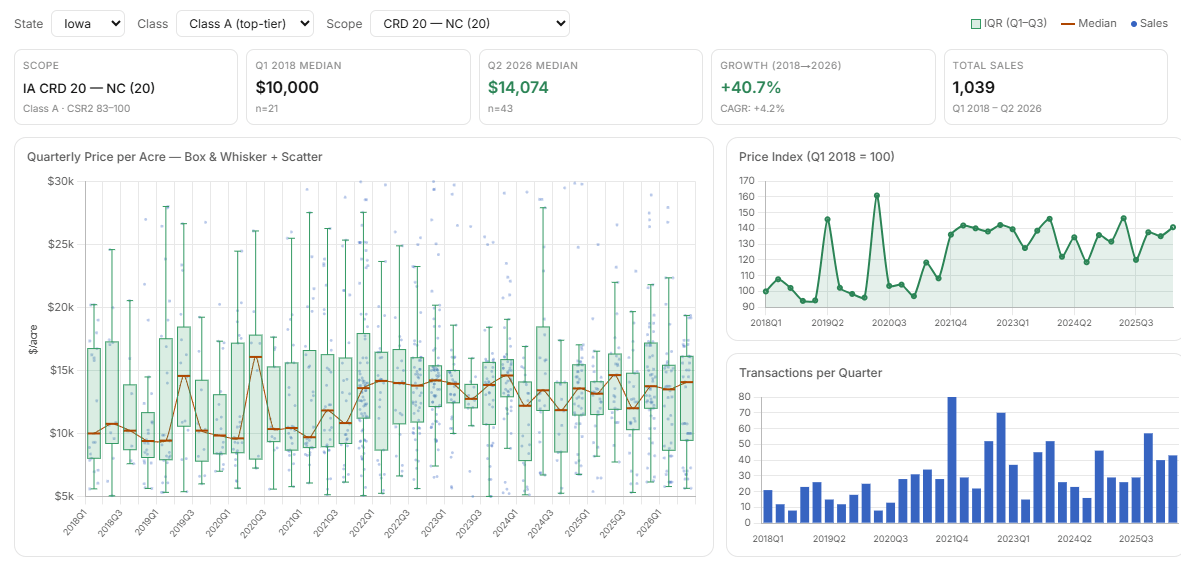
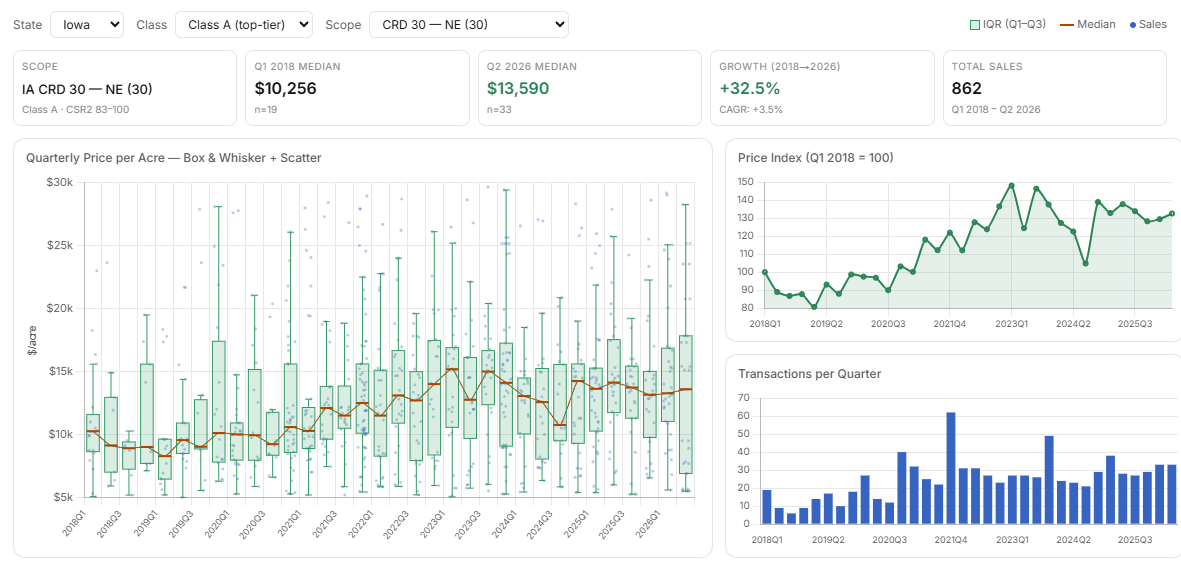
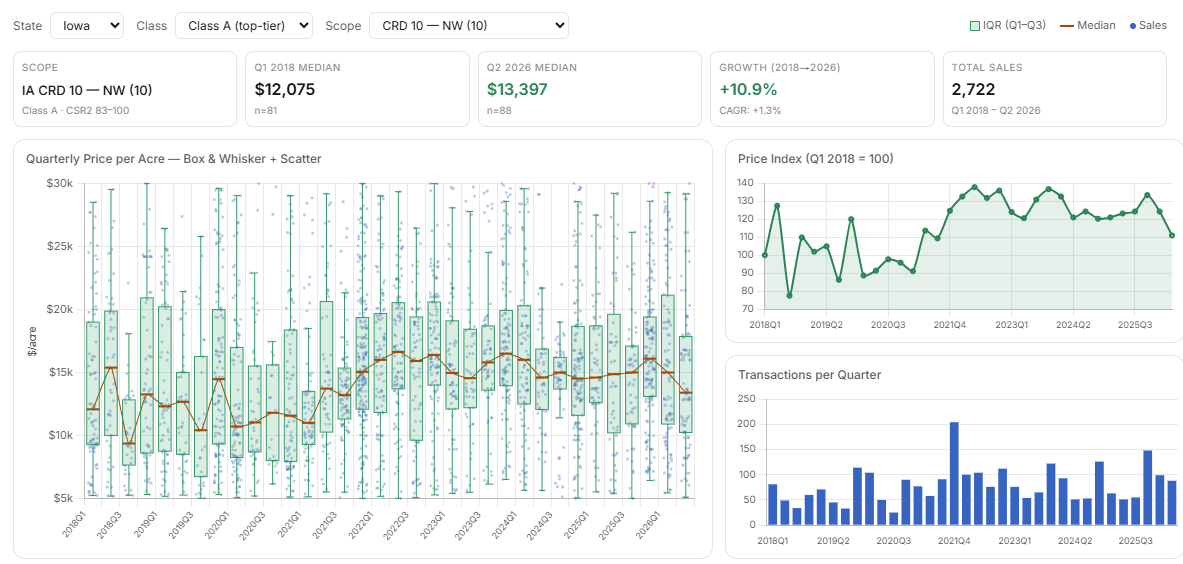
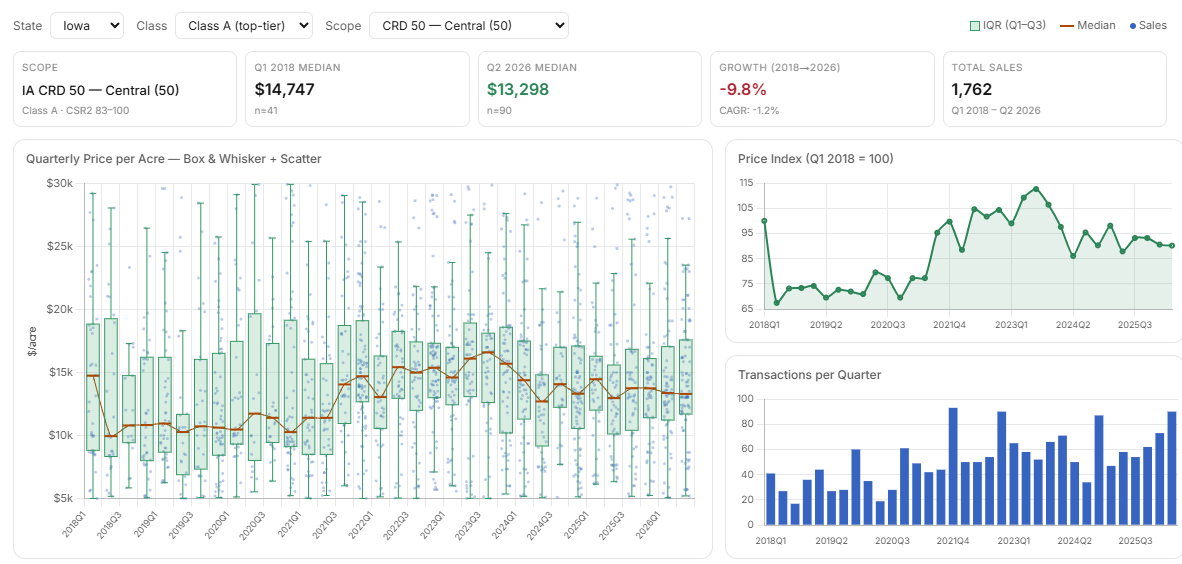
When looking at Class A and Class B cropland broken down by crop reporting district (CRD) for the state of Iowa, the same trend of general stability holds and median values better reflect local market conditions.
Figure 10 - Iowa Class A Farmland by CRD
 Source: Acres, AcreTrader
 Source: Acres, AcreTrader
 Source: Acres, AcreTrader
 Source: Acres, AcreTrader
Why this Matters and the Outlook Going Forward
We demonstrate this transaction data to highlight the reality that we experience every day in our sourcing and underwriting. When reviewing actual transactions over time, it is clear that the farmland market is highly inefficient, varied, and cannot be boiled down to a single price per acre or index. This wide dispersion is consistent over time and presents an opportunity upon which to capitalize with a combination of better sourcing and better data. These market dynamics are typically more pronounced in regions outside of the Corn Belt, such as the Mississippi Delta, Pacific Northwest, West Coast, and Coastal Plains where the significant value of water, or lack thereof, becomes a critical factor.
When looking at both USDA and transaction data, history has shown that farmland goes through periods of stronger appreciation and periods of plateaus. It is important to differentiate the economics of production agriculture, which are historically highly volatile, with farmland as an asset class, which historically is not. Sustained downturns over time for producers can certainly impact the appreciation or depreciation of farmland values. However, the underlying supply and demand factors for farmland greatly mitigate the volatility in farmland values and thus returns. The last 4 years are evidence of this fact. Between Q2 2022 and Q2 2026 both corn and soybean prices decreased (32%). At the same time, according to Iowa State University, corn production costs have increased 37% and soybean production costs have increased 36% since 2021 as a result of inflationary pressures. In addition, in 2022 the Federal Reserve increased interest rates at the fastest pace in history, with rates remaining elevated through Q2 2026. Despite these headwinds, as evidenced by both the USDA data and transaction data presented above, farmland values have remained resilient.
Consistently repeating the discipline of using better data and better sourcing to acquire the right assets at the right prices is only more critical when the rising tide does not lift all boats. While farmland is likely to continue showing periods of varied appreciation, the long-term case for the asset class has not changed. The limited and shrinking supply base of high-quality farmland and water rights, coupled with the increased demand for the food, feed, fiber, and fuel produced by America’s farmland remains. Within this backdrop, we will continue to apply our disciplined framework to capitalize on the inefficiencies in the farmland market and build our portfolio over time.

Managing Director
Drew Lipke joined AcreTrader in 2021 and serves as Managing Director, leading the sourcing and underwriting of farms acquired and managed by AcreTrader LLC. Drew brings more than 14 years of experience across debt and equity capital markets, including roles in corporate credit analysis, equity research, and institutional equity sales. Prior to AcreTrader, Drew spent 12 years at Stephens Inc. covering multiple sectors including aerospace and defense, energy exploration and production, and building materials and construction services, and later served as Managing Director of corporate credit analysis at a fixed-income broker dealer. A Little Rock native, Drew has owned farmland in Arkansas for over a decade. He holds Series 7, 24, 63, 79, 86, and 87 licenses with FINRA and is a registered representative of North Capital Private Securities. Drew earned his degree from the University of Georgia’s Terry College of Business and was recognized by Institutional Investor as an All-America Research Team Rising Star.