
Searching For Places to Hide; A Real Time Example of the Potential Diversification Benefits of Farmland
Key Points:
- The equity markets, and increasingly credit markets, are highly concentrated on a single, capital-intensive theme, the AI infrastructure build out.
- If the AI infrastructure build out does not meet investor expectations due to demand, rapid technological change, execution or financing risks, the financial contagion could reverberate through financial markets due to the market’s concentrated exposure.
- Due to farmland’s negligible exposure to the AI infrastructure build out, historical negative correlation to stocks and bonds, and underlying supply and demand dynamics, investment-grade farmland may serve as a powerful tool to diversify investors from potential risks associated with the AI infrastructure build out over the next few years.
Diversification is a core tenet of investing. Most investors achieve diversification within equities through index funds and across asset classes by combining equities and bonds, commonly referred to as the 60/40 portfolio. The equity market, and increasingly credit markets, are becoming more concentrated on a single, capital-intensive theme, which is the AI infrastructure build out. Increasingly, investors are asking the question of how they can insulate themselves if this historically large buildout does not live up to investor expectations. We believe that due to farmland’s historical negative correlation with financial assets, low obsolescence from technological disruption, and limited exposure to the AI infrastructure build out, farmland can serve as a critical diversifying asset in increasingly concentrated financial markets.
The top 10 companies in the S&P 500 represent approximately 41% of the index, according to Citadel and JP Morgan, with JP Morgan’s AI basket representing 49% of the index. JP Morgan estimates hyperscalers will represent 7.8% of the investment grade bond market in 2027. Of the $5 trillion in projected data center and AI funding sources between 2026-2030, $2.1 trillion is estimated from the investment grade bond market, with another $2.1 trillion needed from alternative capital, high yield bonds, leverage loans and securitization.
Concentration of the US stock market in a single theme is at its highest since the railroad era of the late 1800s. Because of passive investing and retirement accounts, more households and institutions are exposed to AI than in any prior concentration episode. In addition, many non-tech sectors such as industrials are heavily exposed to the AI CAPEX cycle, making equity portfolio diversification increasingly difficult.
High utilization of AI, increased adoption of AI applications, and continued model improvements may support the projected financing needs and generate sufficient cash flows that meet current investor expectations. However historical infrastructure booms, such as railroads and telecommunications, have shown that large, capital-intensive expansions can exhibit boom and bust cycles if demand doesn’t meet expectations, financial conditions tighten, or technology adoption does not align with the maturity of the debt issued against it.
It is not our place to forecast how AI demand ultimately unfolds, who wins in the face of rapid technological change, or if the risks of execution bottlenecks and increasing leverage justify the potential rewards. We do believe that diversifying into hard, non-correlated, critical assets with low obsolescence may provide investors a way to insulate portfolios from broader financial contagion if the current AI infrastructure build out does not meet investor expectations in the coming years. Farmland’s unique characteristics of low obsolescence, shrinking supply, increasing demand, and low ongoing maintenance requirements make it the ultimate HALO investment strategy.
Figure 1 - The Top 10 Companies in the S&P 500 Represent 41% of Index Market Value
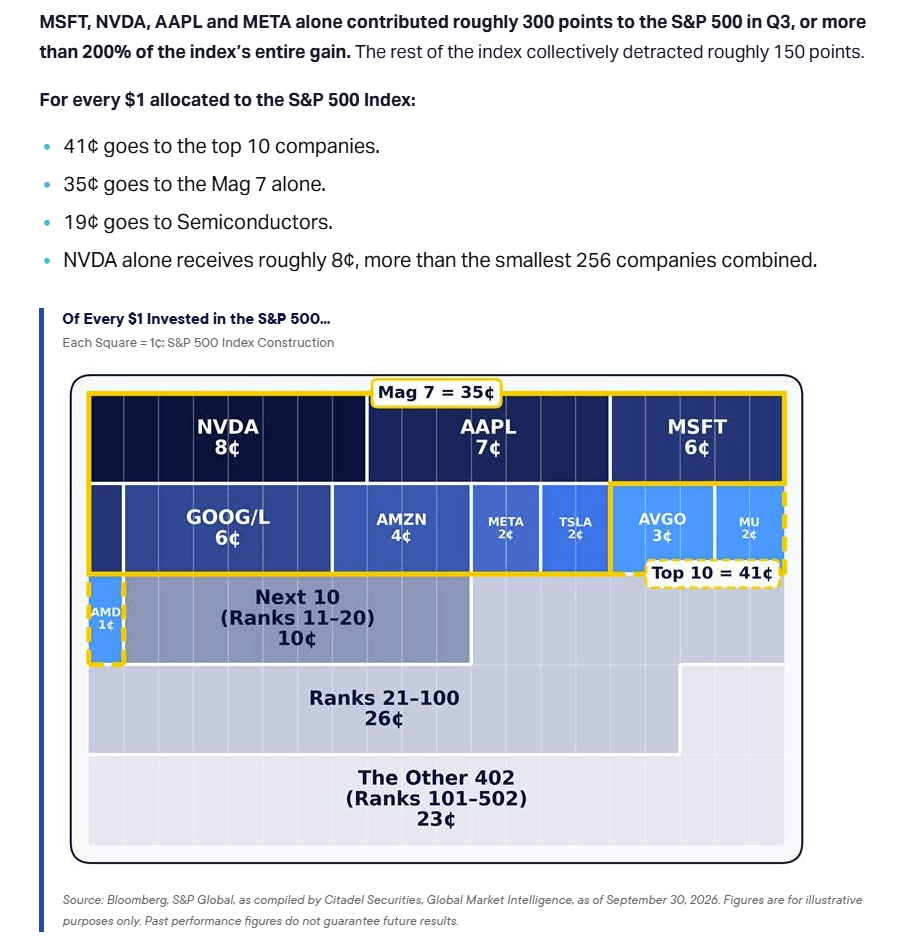
Figure 2 - The Top 10 Companies in the S&P 500 Account for the Largest Weighting in History
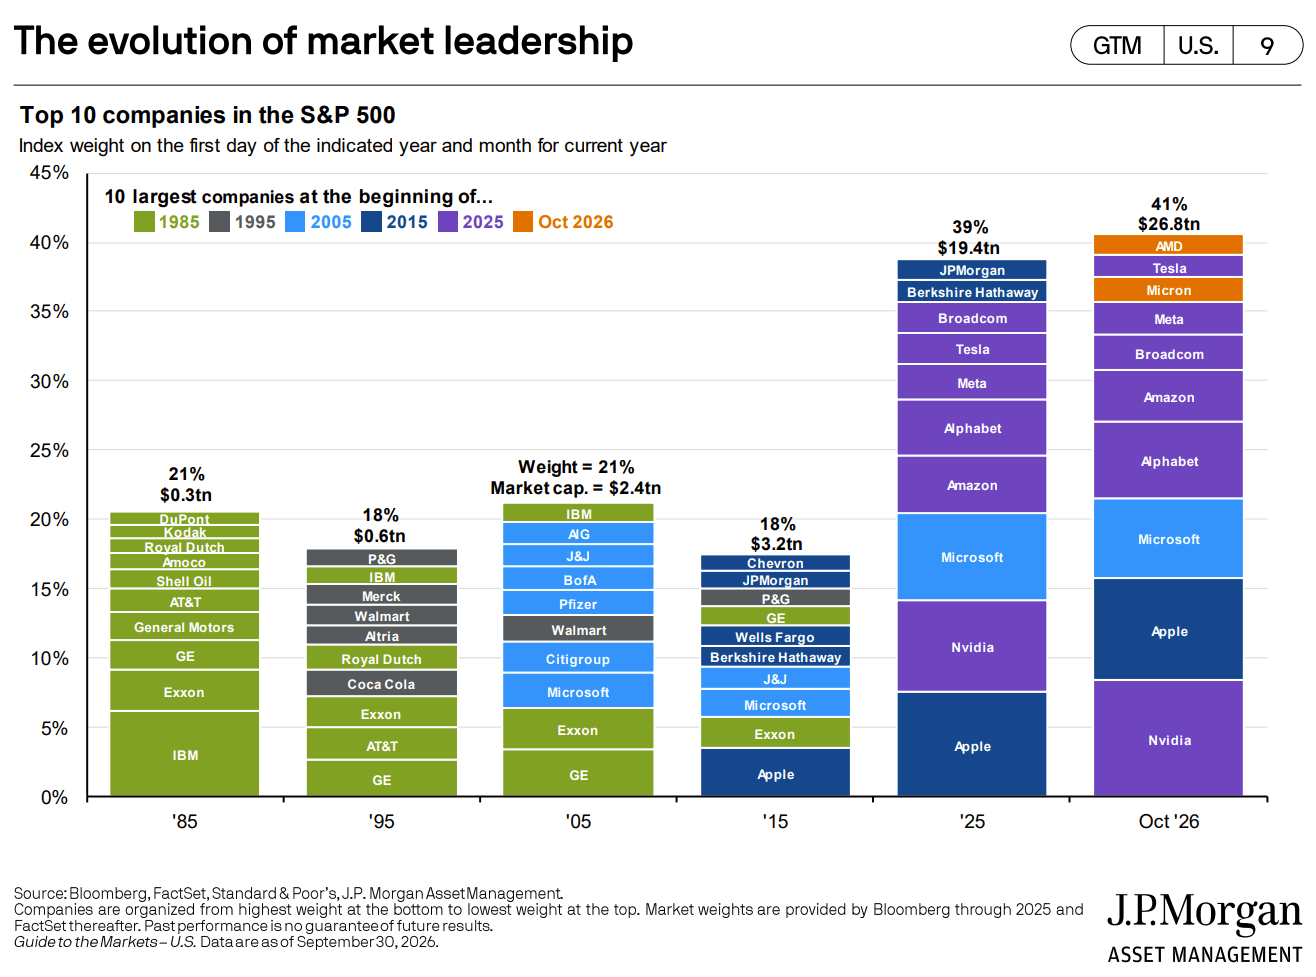
Figure 3 - The AI infrastructure boom represents a historically large investment in a large-scale physical network, whose returns are dependent on uncertain future demand that requires substantial external financing.
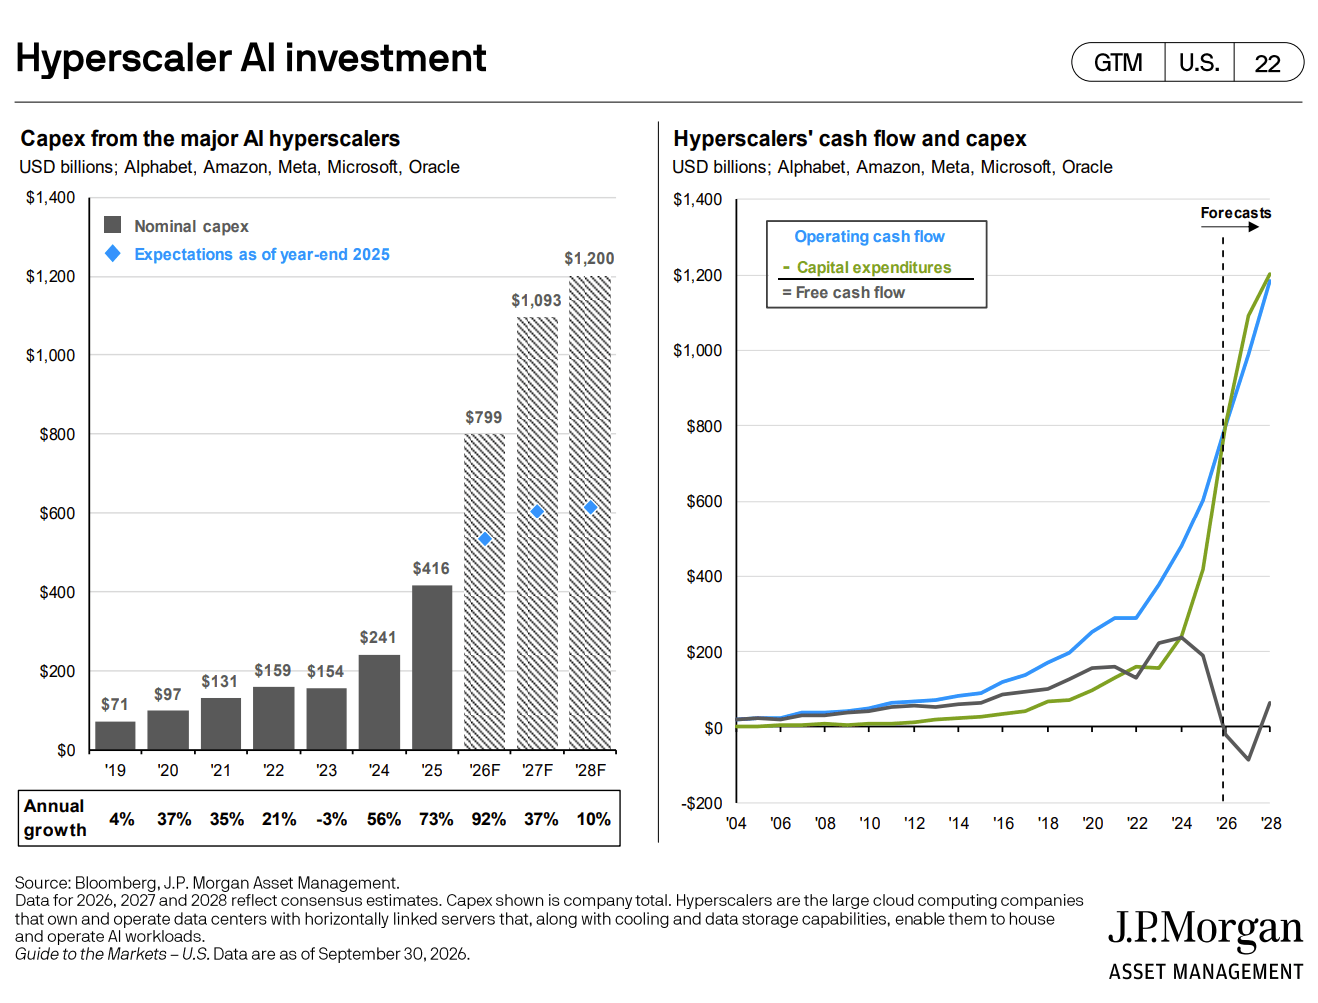
Figure 4 - The AI infrastructure boom represents a historically large investment in a large-scale physical network, whose returns are dependent on uncertain future demand that requires substantial external financing.
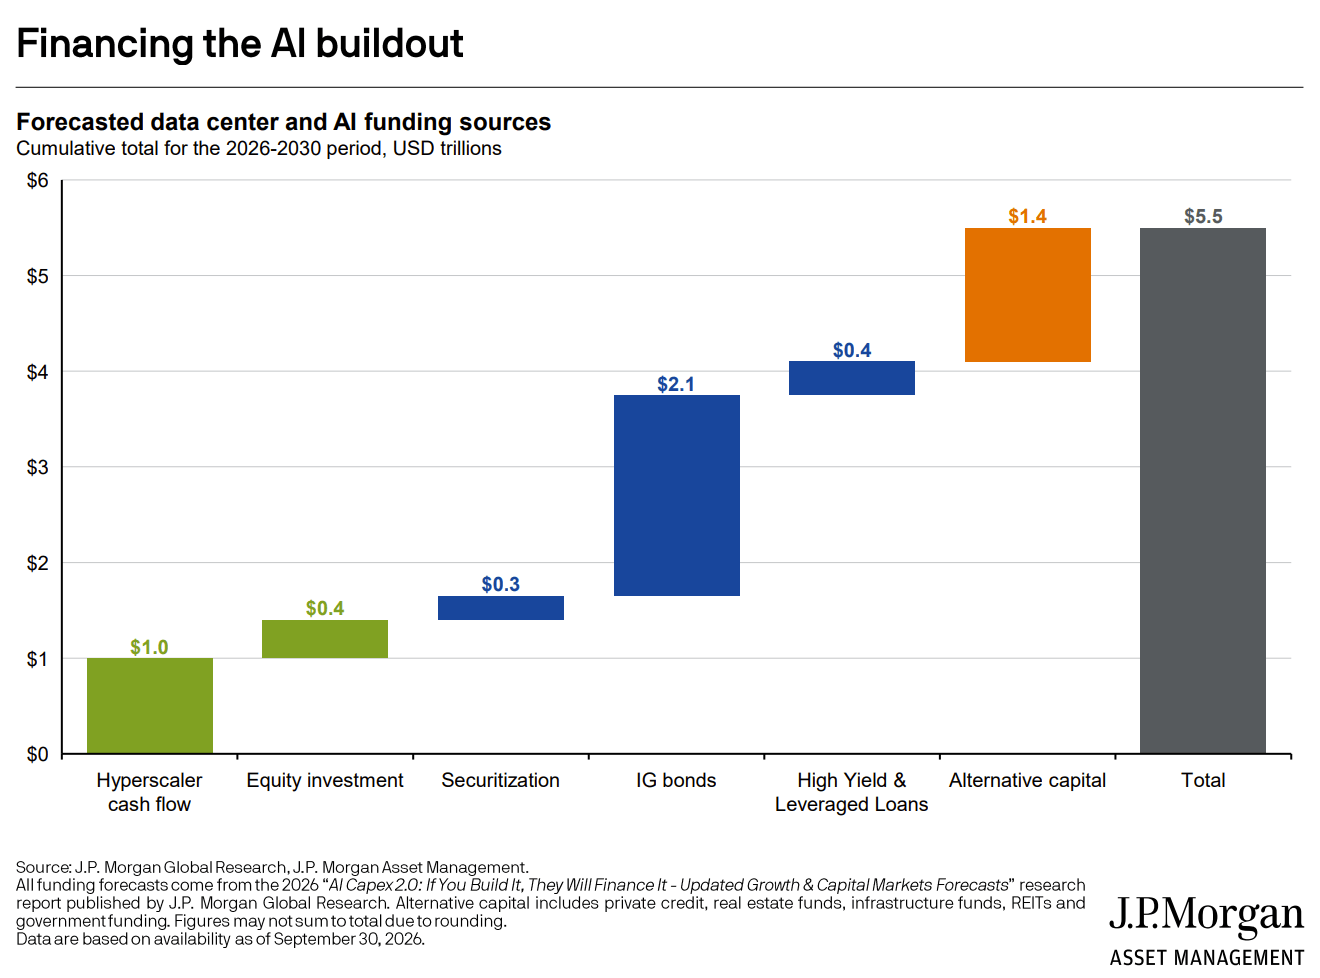
Figure 5 - The AI infrastructure boom represents a historically large investment in a large-scale physical network, whose returns are dependent on uncertain future demand that requires substantial external financing.
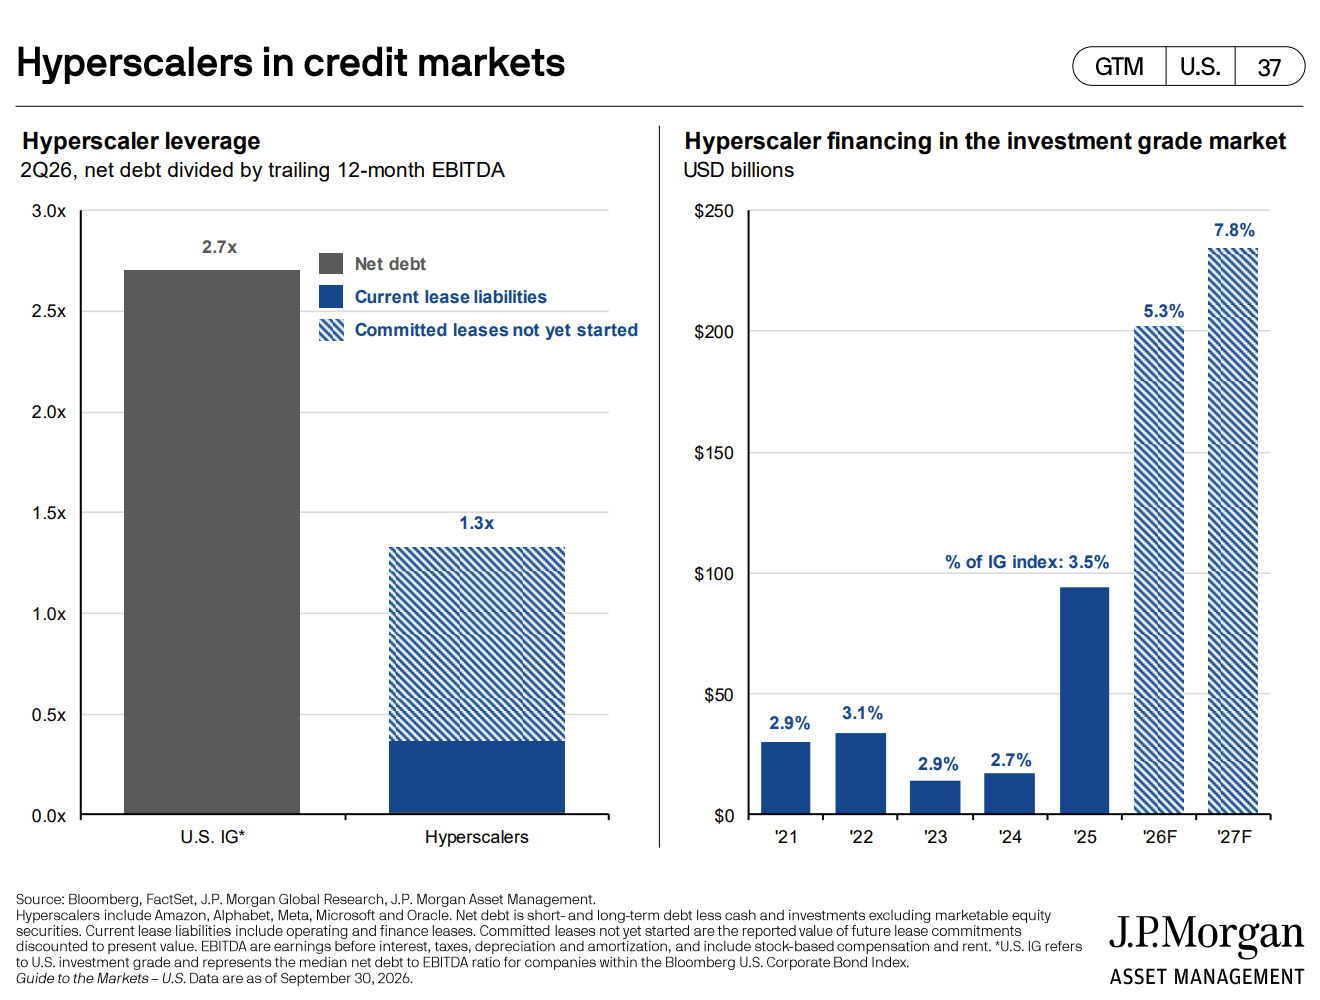
Figure 6 - The AI infrastructure Boom in Historical Context
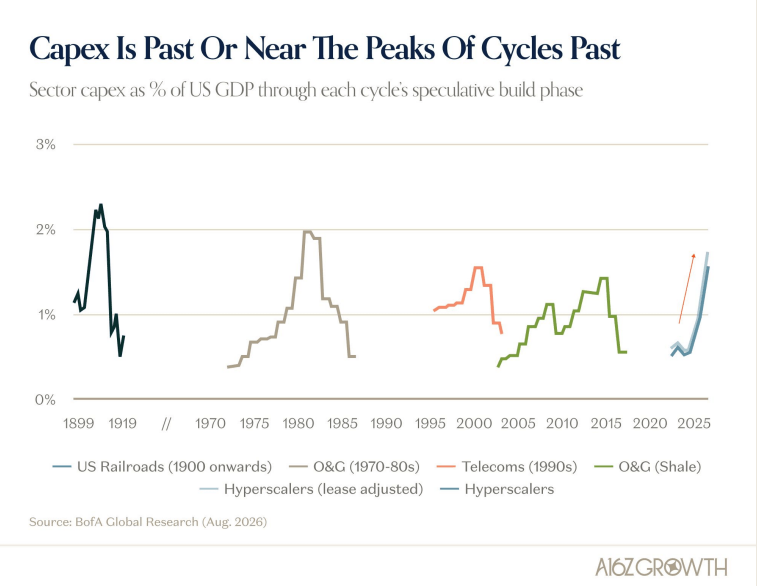 Source: Andreessen Horowitz (2026)
Figure 7 - The AI Buildout is Estimated to be the Largest U.S. Capital Expenditure Boom in History
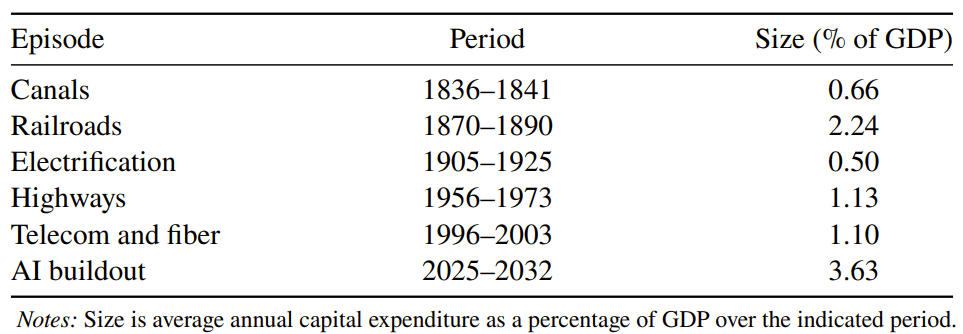 Source: Brookings Papers on Economic Activity (2026)
Figure 8 - The AI infrastructure Boom Has Been a Key Driver of the Manufacturing Economy
The AI boom has driven up expenses for everything from chips to copper. Demand for equipment that generates and carries electricity has resulted in supplier backlogs stretching beyond 2030, according to Bloomberg Intelligence. If the current order books for the AI infrastructure build out do not materialize as currently expected, the reverberations through the manufacturing sector will be significant, highlighting the potential risk to the broader equity markets and economy.
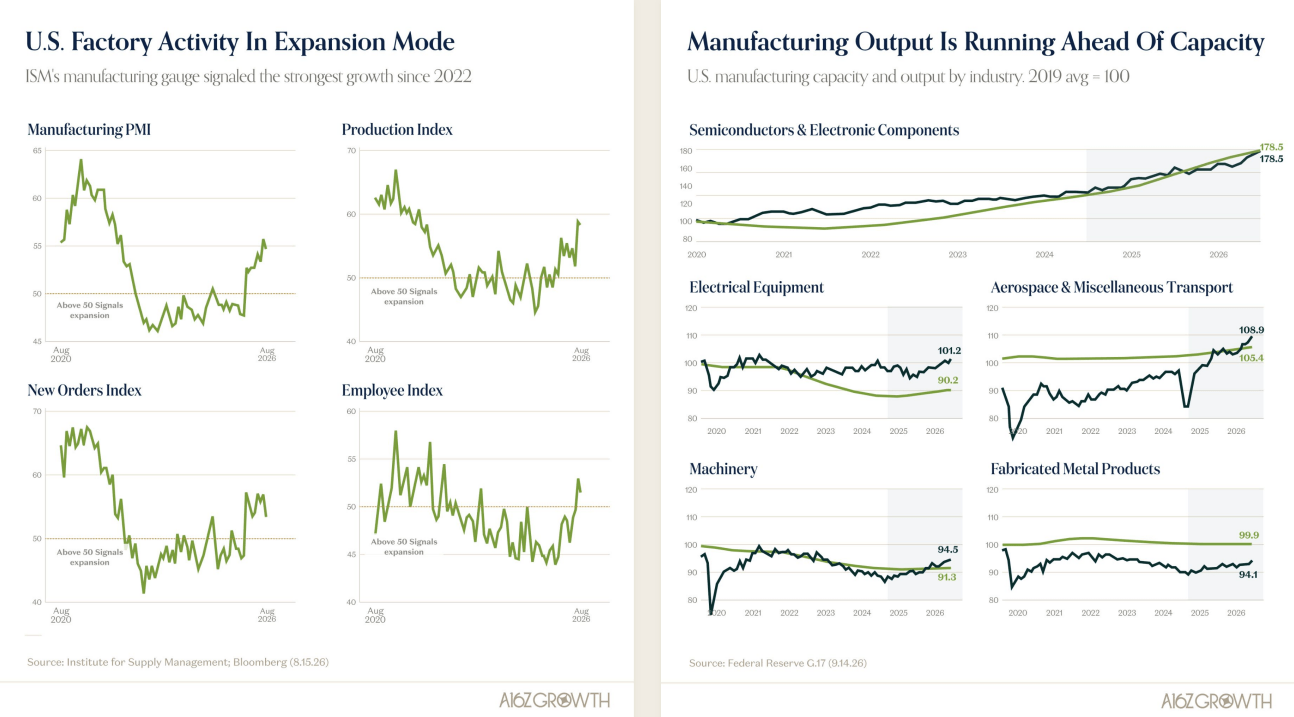 Source: Andreessen Horowitz (2026)
Figure 9 - Frontier Labs Order Books are Heavily Reliant on External Fundraising
According to Pitchbook, OpenAI’s September presentation projected $278 billion of negative free cash flow 2026 - 2030. That is more than the $181 billion in equity that OpenAI has raised in its entire history, meaning their projections, and compute commitments, are heavily reliant on raising additional capital. The presentation projected ~$856 billion of spending on computing power and infrastructure by the end of 2030.
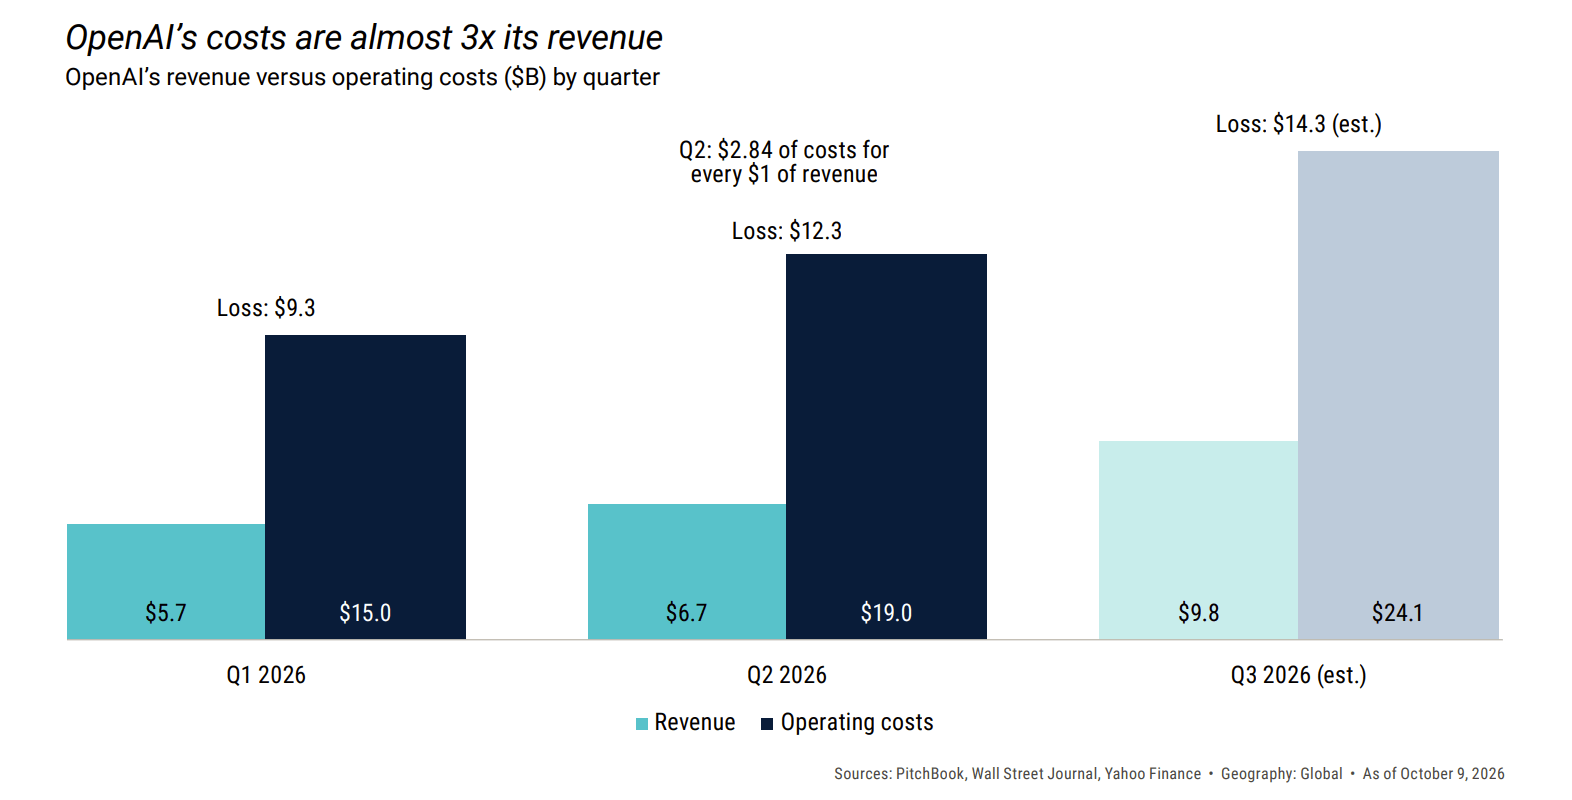
Figure 10 - Will Treasuries Provide Diversification?
The 10-year Treasury yield recently hit levels not seen since April 2002 due to elevated inflation expectations and ongoing fiscal concerns. As we have highlighted in the past, historically during periods of elevated inflation, equities and treasuries demonstrate a positive correlation, with treasuries not serving as the potential needed buffer to investor’s portfolios from equity drawdowns. As shown below, rolling 24-month correlation has remained positive since 2022. One of the primary drivers of economic growth today, the AI infrastructure build out, to date has been immune to higher interest rates and the soaring costs for electricity, high bandwidth memory, construction, and other input costs. This limits the Federal Reserve’s ability to tame elevated inflation.
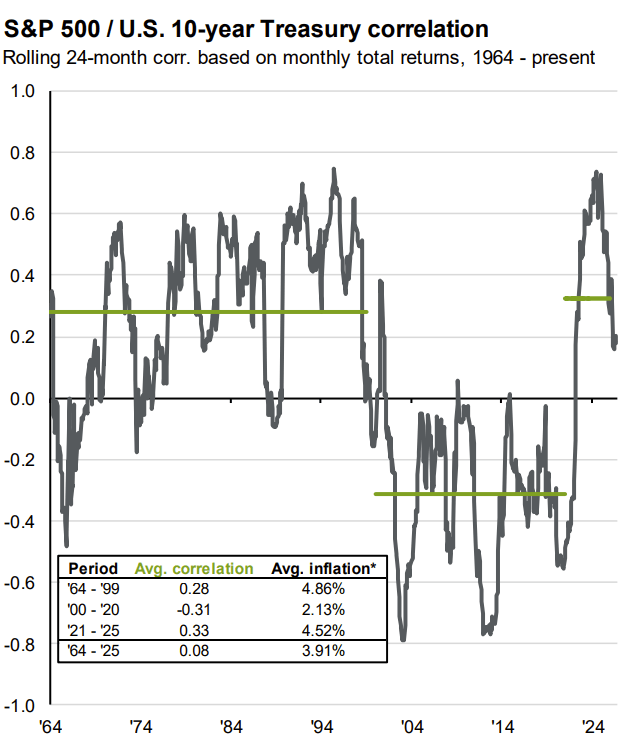 Source: Bloomberg, FactSet, Haver Analytics, LSEG, Standard & Poor’s, J.P. Morgan Asset Management Guide to the Markets - U.S. Data are as of September 30, 2026
IMPORTANT DISCLOSURES. Past performance is no guarantee of future results. This article is not an offer to sell or a solicitation of an offer to buy any security, and nothing in it constitutes investment, tax or legal advice Past performance is no guarantee of future results. Securities previously offered through North Capital Private Securities Corporation, member FINRA / SIPC. Investments in private placements are speculative, illiquid and may result in the complete loss of capital.

Managing Director
Drew Lipke joined AcreTrader in 2021 and serves as Managing Director, leading the sourcing and underwriting of farms acquired and managed by AcreTrader LLC. Drew brings more than 14 years of experience across debt and equity capital markets, including roles in corporate credit analysis, equity research, and institutional equity sales. Prior to AcreTrader, Drew spent 12 years at Stephens Inc. covering multiple sectors including aerospace and defense, energy exploration and production, and building materials and construction services, and later served as Managing Director of corporate credit analysis at a fixed-income broker dealer. A Little Rock native, Drew has owned farmland in Arkansas for over a decade. He holds Series 7, 24, 63, 79, 86, and 87 licenses with FINRA and is a registered representative of North Capital Private Securities. Drew earned his degree from the University of Georgia’s Terry College of Business and was recognized by Institutional Investor as an All-America Research Team Rising Star.